Energy Regains Leadership as Inflation Surges
Energy stocks are leading the market again as inflation surges and earnings season winds down.
The S&P 500 rose as much as 1.6 percent through Thursday of last week. However Friday saw the biggest drop since late March, resulting in a weekly gain of just 0.1 percent for the period between Friday, May 8, and Friday, May 15. It was the smallest weekly advance since late March.
Perhaps more noteworthy was the 6.7 percent rally in energy stocks, their biggest weekly gain in almost two years. Crude-oil futures also climbed 11 percent.
The surge in energy seemed to reflect a new sentiment that may distract from the AI boom and historically strong corporate earnings. Several forces seem to be at work involving inflation, bond yields and oil supplies.
Inflation Surges
Last week featured consumer prices, producer prices and export/import prices for April. All three were higher than expected. While energy costs played a big role, the data suggested that price increases may have become embedded and structural.
| Charles River Laboratories (CRL) | -15% |
| Carvana (CVNA) | -14% |
| Intel (INTC) | -13% |
| Super Micro Computer (SMCI) | -12% |
| Constellation Energy (CEG) | -12% |
| Source: TradeStation data |
The consumer price index (CPI) on Tuesday rose 3.8 percent from a year before. It exceeded estimates and was the biggest increase since May 2023. Services drove core inflation higher than expected, a potential indication of sticky inflation.
Inflation is “going the wrong way, and it’s going the wrong way not just in oil-related things and not just in tariff-related things,” Chicago Federal Reserve President Austan Goolsbee said shortly after the report.
The producer price index (PPI) on Wednesday was even more dramatic. Its topline reading of 1.4 percent was almost triple the forecast amount, and the sharpest acceleration since March 2022. Machinery and trucking services helped drive the increase. The previous month’s reading was also revised higher. Year-over-year, PPI rose a dramatic 6 percent.
On Thursday, export prices rose triple the expected amount and import prices were almost twice consensus. Chinese and Japanese prices separately surprised to the upside. Is inflation becoming a broader global problem?
Bonds and the Fed
U.S. Treasury yields jumped in response to the higher inflation. The rates on the two- and 10-year notes closed at the highest level since early last year. The 30-year Treasury bond’s yield closed at its highest level since mid-2007 (although it’s still slightly below intraday peaks in 2023 and 2025). All three yields had their biggest weekly gains since the April 2025 tariff panic.
Last week also saw weak demand at auctions for 3-, 10- and 30-year U.S. Treasury securities. Lower bond prices correspond with higher yields, so that’s consistent with a belief that borrowing costs need to go higher. (Global yields for German, Japanese and British bonds are also at multiyear highs.)
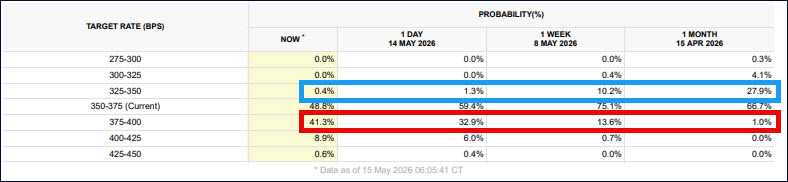
CME’s FedWatch tool showing interest rate expectations on December 9. Changes in the last month are marked.
CME’s FedWatch tool now shows a 41 percent chance the Federal Reserve will raise interest rates at least 25 basis points this year. That’s up from 14 percent the previous week and 1 percent in mid-April. Odds of a rate cut dwindled from 28 percent to less than 1 percent.
Speaking of the Fed, Kevin Warsh was confirmed as chairman on Wednesday. He faces a potentially difficult balancing act between a White House wanting rate cuts and a board increasingly wary of inflation. Former Chair Jerome Powell also remained on the board as a governor, which last happened in 1948.
Oil Crunch Coming?
The third big story is continued tightness in the energy market. Crude-oil inventories shrank by 4.3 million barrels in the week ended May 8, almost twice the expected amount. But more importantly, the Strategic Petroleum Reserve (SPR) shrank by 8.6 million barrels — its biggest drop on record.
The Energy Information Administration’s broadest reading of oil products (WTTSTUS1) has also contracted by 67.9 million barrels in the last five weeks. That’s not only the biggest five-week decline ever. It’s also 70 percent greater than the biggest drawdowns of the Ukraine crisis in 2022.
Note: This data (WTTSTUS1) often has one-off fluctuations, but when smoothed over several weeks it highlights a trend of narrowing supply. It’s also potentially useful because it adjusts for SPR releases — unlike the more popular commercial stocks reading (WCESTUS1).
More oil is also leaving the country as supplies tighten globally. Daily U.S. exports have exceeded 12.7 million barrels every week since April 10. They were never that high for a single week before the Iran war.
A separate note by UBS estimated that global inventories may hit a record low by the end of this month.
Cisco Surges
| Cisco Systems (CSCO) | +22% |
| Palo Alto Networks (PANW) | +17% |
| Zebra Technologies (ZBRA) | +15% |
| Coherent (COHR) | +14% |
| CrowdStrike (CRWD) | +13% |
| Source: TradeStation data |
While oil and yields climbed, technology names associated with AI still accounted for the most dramatic moves at the individual-stock level.
Cisco Systems (CSCO) had its biggest weekly gain in 25 years after earnings, revenue and guidance beat estimates. Demand from hyperscalers and AI data centers fueled the results. The maker of networking equipment, one of the biggest players in the 1990s tech boom, also plans to cut 4,000 jobs.
Palo Alto Networks (PANW) had its best week in four years and hit a record high for the first time since October. The cybersecurity company didn’t have hard news like earnings. (Results are due June 2.) Instead it seemed to benefit from investors returning to software makers and optimism about demand for its products. CrowdStrike (CRWD) followed a similar path.
Earnings lifted Zebra Technologies (ZBRA) and Coherent (COHR) kept running on the heels of strong results on May 6.
In addition to energy stocks, solar and cybersecurity were the best-performing groups last week. Metals, homebuilders, retailers, banks and global stocks fared the worst.
Charting the Market
The S&P 500 has climbed for seven straight weeks — the longest positive streak since 2023. The index has only risen for seven straight weeks three times in the last decade, according to TradeStation data.
Wilder’s Relative Strength Index (RSI) is also dropping from an overbought condition. Traders looking for a pullback may view the price zone between 7,273 and 7,294 as potential support. Those levels correspond to the high on May 1 and a price gap on May 6. They’re also near the rising 21-day exponential moving average.
In addition to the S&P 500, investors may take their cues from Treasury yields and crude-oil prices. Further upside in either may curb risk appetite in stocks.
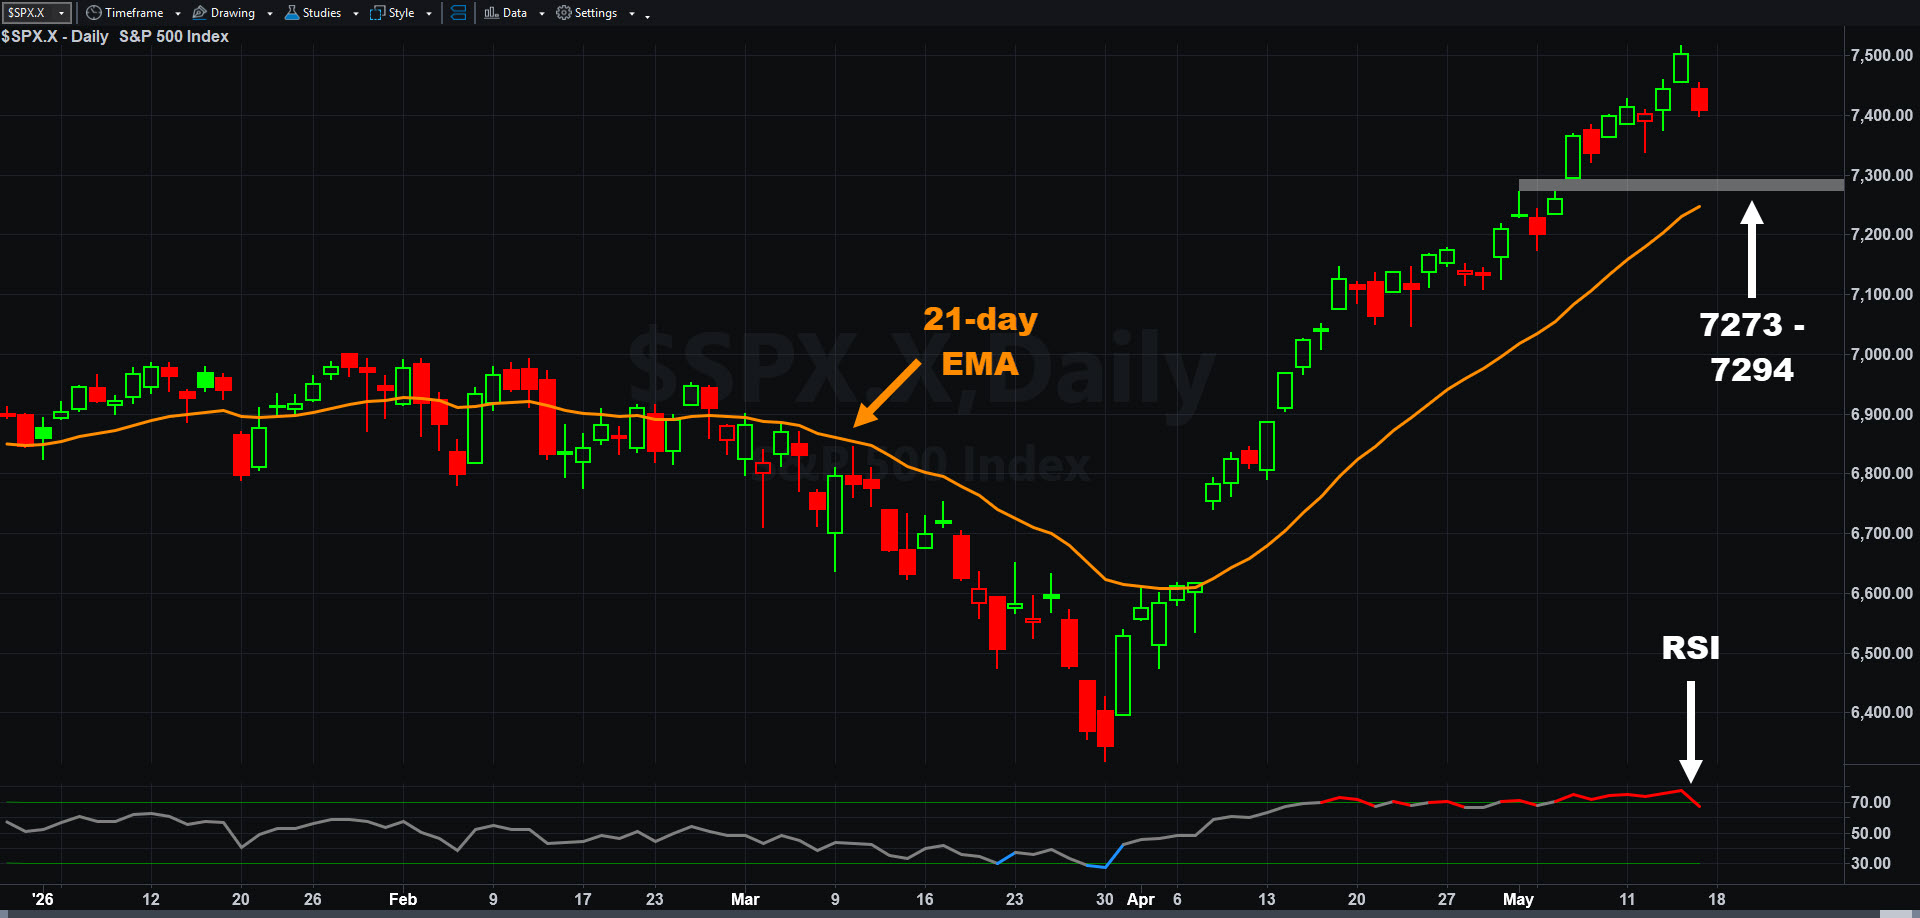
S&P 500, daily chart, with select patterns and indicators.
The Week Ahead
This week has a quieter agenda, with some big events on Wednesday. Several Fed officials also speak.
NAHB’s homebuilder sentiment index is the main item today.
Tomorrow brings pending home sales, plus earnings from Home Depot (HD) and Alphabet’s (GOOGL) Google I/O 2026 developer event. Agentic AI is expected to be an important theme.
Wednesday is the busiest day:
- 10:30 a.m. ET: Crude-oil inventories may impact energy prices
- 2 p.m.: Minutes from the last Fed meeting may impact interest rates
- 4 p.m. ET: Nvidia (NVDA), the world’s most valuable company, reports earnings
Thursday features initial jobless claims, housing starts and building permits. Walmart (WMT) and Deere (DE) announce quarterly results.
Friday is mostly quiet.
.jpg&w=3840&q=75)