Are Energy Stocks Taking Leadership?

Check out our next “State of the Market,” on Monday, 3/24.
Sizing Up the Market
- S&P 500 stalls below 5700
- Has Nov. 4-5 range (election) gone from support to resistance?
- Another potential range at 5733 (3/4 low) to 5773 (1/13 low)
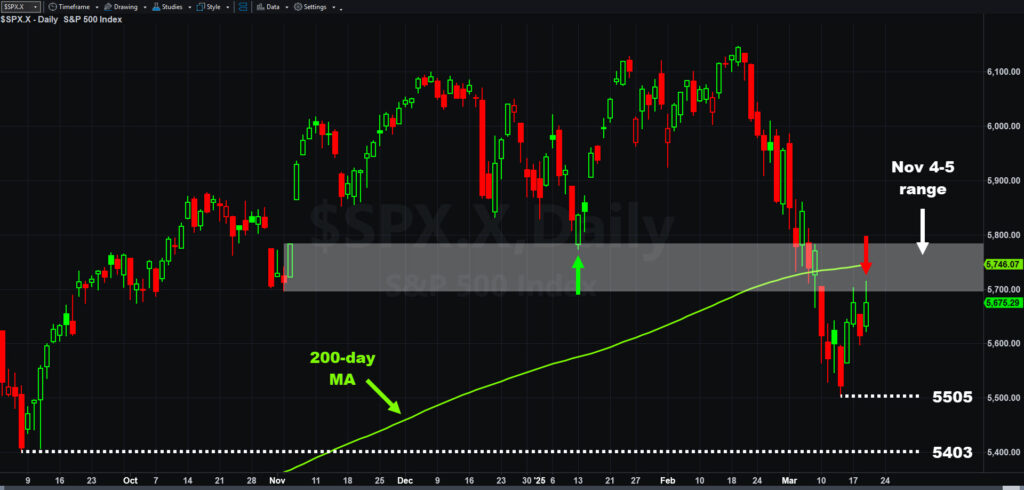
S&P 500, daily chart, with select patterns and indicators.
Fed Plays for Time
- Fed lowers GDP estimate from 2.1% → 1.7%
- Fed raises core PCE estimate from 2.5% → 2.8%
- Fed cuts QT from $25B → $5B (only “dovish” move)
- Dot plot incrementally hawkish but still sees 2 cuts in 2025.
- Changes from December to March:
- No cuts: Up from 1 → 4
- 1 cut: Up from 3 → 4
- 3 cuts: Down from 3 → 2
- 4-5 cuts: Down from 2 → 0
| Sector | P/E ratio (Trailing) | YTD % |
| Energy | 8.9 | +8.4% |
| Financials | 12.5 | +2.6% |
| Materials | 16 | +3.6% |
| Communications | 16 | +0.3% |
| Healthcare | 17 | +6.8% |
| S&P 500 | 18 | -3.5% |
| Utilities | 18 | +4.3% |
| Industrials | 18.5 | +1.4% |
| Consumer Staples | 20 | +1.5% |
| Technology | 24 | -7.6% |
| Consumer Discretionary | 24 | -12% |
| Real Estate | 34 | +3.2% |
| Sources: ETFdb.com / VettaFi, TradeStation data |
Energy in Focus
- Energy is the top-performing sector in 2025 and only positive sector in March as of March 19.
- Lowest price/earnings ratio
- Potential beneficiary of stagflation
- Potential beneficiary of global rotation, geopolitical risk
- Ninepoint portfolio manager Eric Nuttall on CNBC: U.S. shale production starting to peak, supply crisis coming.
- Natural gas advancing on LNG exports, depleted storage
- Find energy stocks with Scanner:
- Symbol universe → “All Stocks
- < Select Criteria > → Indicator → Sector = “Energy”
Upcoming Events
- Sun 3/23-Mon 3/24: China Development forum
- Tue 3/25: Consumer confidence
- Wed 3/26: Durable goods, crude oil inventories
- Earnings: DLTR CHWY
.jpg&w=3840&q=75)