End of AI Boom? Tech Crumbles as Value Gains

Tech is reeling as investors unload AI stocks and worry about the economy.
The S&P 500 slid 1 percent between Friday, February 21, and Friday, February 28. It was the fourth decline in the last five weeks, bringing the index back to levels last seen in mid-January.
Some big questions focused on growth stocks associated with artificial intelligence:
- Margins: Nvidia’s (NVDA) results surpassed estimates, but margin guidance missed. That may reflect weaker pricing and increasing competition. Pure Storage (PSTG), which benefited from AI demand last year, reported narrower margins on increased competition for memory.
- Revenue misses: NetApp (NTAP) and Dell Technologies (DELL) missed revenue estimates and issued weak outlooks.
- AI hesitancy? Salesforce.com (CRM) guided earnings and revenue below consensus. The cloud pioneer said customers were adopting AI Agents more slowly than hoped.
- HP (HPQ), which surged on AI hopes a year ago, issued weak guidance amid potential tariff costs.
- More Chinese chip restrictions? Bloomberg reported President Trump may increase restrictions on shipping semiconductor technology to China.
| Super Micro Computer (SMCI) | -26% |
| Teleflex (TFX) | -24% |
| NetApp (NTAP) | -20% |
| Viatris (VTRS) | -18% |
| Sempra Energy (SRE) | -18% |
| Source: TradeStation Data |
All told, the Nasdaq-100 dropped 3.4 percent and lagged the S&P 500 by the widest margin since November 2022.
Dovish Data?
Several economic reports were weaker than forecast. Consumer confidence had its biggest drop since August 2021. New home sales and pending home sales both missed projections. Initial jobless claims spiked unexpectedly and the trade deficit hit the widest level ever. Personal spending also had its biggest drop in almost four years.
As a result of those numbers, the Atlanta Federal Reserve’s GDPNow dropped from 2.3 percent growth in the current quarter to a contraction of 1.5 percent.
While those numbers may sound bearish, they increased the potential chance of a Fed rate cut. CME’s FedWatch showed the odds of policymakers leaving rates unchanged in June fall by more than half. Chances of a bigger cut also increased.
A lot of negativity has also been priced into the market, according to some measures. More than 60 percent of respondents were bearish in the American Association of Individual Investors’ weekly poll. It was the most negative reading in 2-1/2 years, which may suggest investors had already exited stocks and had ample cash on the sidelines.
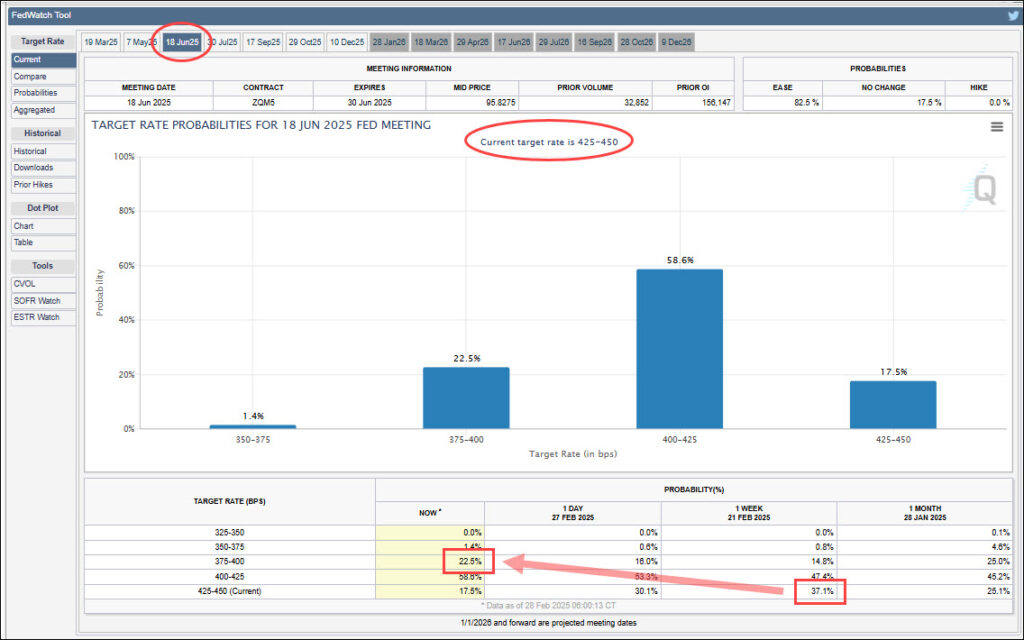
CME FedWatch tool. Boxes mark the changing probabilities of monetary policy at the June 18 meeting.
Second, Wall Street is worrying about S&P 500 earnings because of tariffs and inflation. FactSet reported that analysts cut profit estimates for the current quarter more than normal. The research firm also said companies beat estimates by smaller margins than average last quarter.
Value Rotation?
Financials rose the most last week, led by insurance companies like Erie Indemnity (ERIE), Cincinnati Financial (CIFN) and American International (AIG). Healthcare, industrials and consumer staples also outperformed.
Those are all classic “value” sectors, as opposed to “growth” sectors like tech. Their coordinated strength — despite a relative lack of news — may suggest money is shifting to value stocks as growth names associated with AI lose favor.
| Erie Indemnity (ERIE | +12% |
| Fair Isaac (FICO) | +11% |
| West Pharmaceutical Services (WST) | +10% |
| AES (AES) | +9.4% |
| Cincinnati Financial (CINF) | +9.4% |
| Source: TradeStation Data |
Real-estate stocks also climbed last week, supported by lower bond yields.
After technology, utilities and consumer discretionaries fell the most. Utilities were linked to AI because of electricity demand by data centers. Discretionaries struggled as Tesla (TSLA) plunged to its 200-day moving average.
Chinese tech stocks and precious metals also fell.
Charting the Market
The S&P 500 made a big swing last week. It was down 3 percent at its low on Friday, but clawed back more than half the decline. TradeStation data also showed more member stocks hitting new 52-week highs — even as the overall index slid. That illustrates how capital is shifting to new stocks.
Next, Wilder’s relative strength index (RSI) reached its lowest level since August. The stochastics oscillator also fell below 20 before turning up. Both of those may suggest the index is rebounding from oversold conditions.
The S&P 500 has stayed within its price range since the election on November 5. Some chart watchers may think the index is waiting for confirmation of lower inflation before attempting a potential breakout. (If prices stay high, they may expect a correction.) That could make these upcoming events especially important:
- March 12: Consumer price index (CPI)
- March 19: Fed meeting, with a “dot plot” forecasting rate cuts.
Two other charts could also be important to investors.
First, the 10-year Treasury yield fell the most since late November. That’s potentially consistent with the Fed cutting rates.
Second, Cboe’s volatility index (VIX) tried to jump above 20 but failed to hold. That may suggest bearishness peaked.
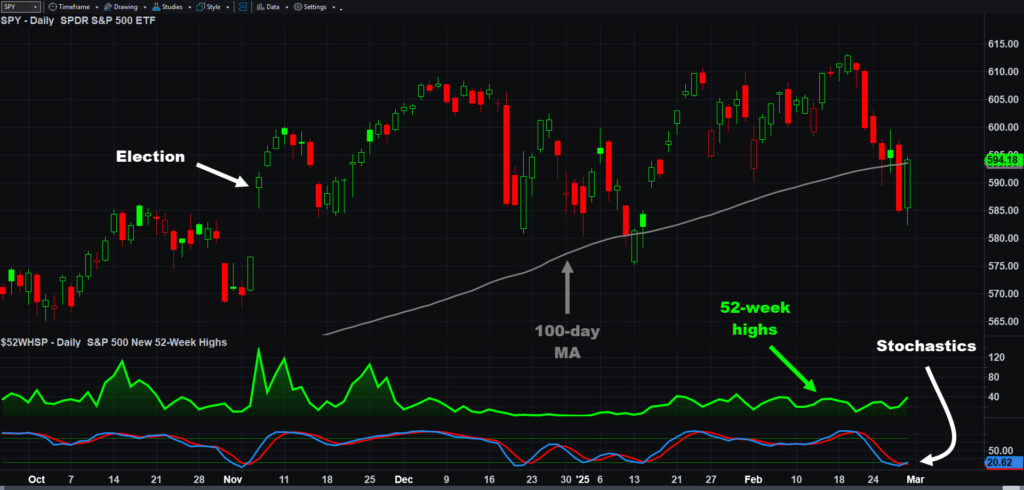
SPDR S&P 500 ETF (SPY), daily chart, with select patterns and indicators.
The Week Ahead
This week features key monthly data and some noteworthy earnings reports.
The Institute for Supply Management’s manufacturing index is due this morning.
Tomorrow brings results from Target (TGT), Best Buy (BBY) and CrowdStrike (CRWD). Tariffs are expected to take effect against Mexico and Canada. President Trump delivers the State of the Union Address in the evening.
Wednesday features ADP’s private sector employment report, ISM’s service data and crude-oil inventories. Marvell Technology (MRVL) and Rigetti Computing (RGTI) report earnings.
Thursday’s main items are initial jobless claims. Broadcom (AVGO), Costco (COST) and Kroger (KR) issue results.
Friday brings the key non-farms payrolls report and a speech by Fed Chairman Jerome Powell at 12:30 p.m. ET.
| ETF | 1 Year | 5 Years | 10 Years |
| SPDR S&P 500 (SPY) | +24.63% | +87.06% | +201.74% |
| As of January 31, 2025. Based on TradeStation Data |
Exchange Traded Funds (“ETFs”) are subject to management fees and other expenses. Before making investment decisions, investors should carefully read information found in the prospectus or summary prospectus, if available, including investment objectives, risks, charges, and expenses. Click here to find the prospectus.
Performance data shown reflects past performance and is no guarantee of future performance. The information provided is not meant to predict or project the performance of a specific investment or investment strategy and current performance may be lower or higher than the performance data shown. Accordingly, this information should not be relied upon when making an investment decision.
.jpg&w=3840&q=75)