Chart of the Day: Is Apple Rolling Over?

Stocks Climb as AI Demand Shifts to CPUs, Analog
The next phase of the AI trade could be taking shape as investors scramble for CPUs and analog chips.
Call toll-free 800.328.1267

Apple has done little for a long time, and some traders may think the tech giant is rolling over.
The first pattern on today’s chart is the weekly close of $278.78 on December 5. AAPL tried to cross above that level the following week but failed. It was revisited early last month without breaking. That may suggest resistance is in …
For more, please click here to view the related idea and chart analysis on TradingView.
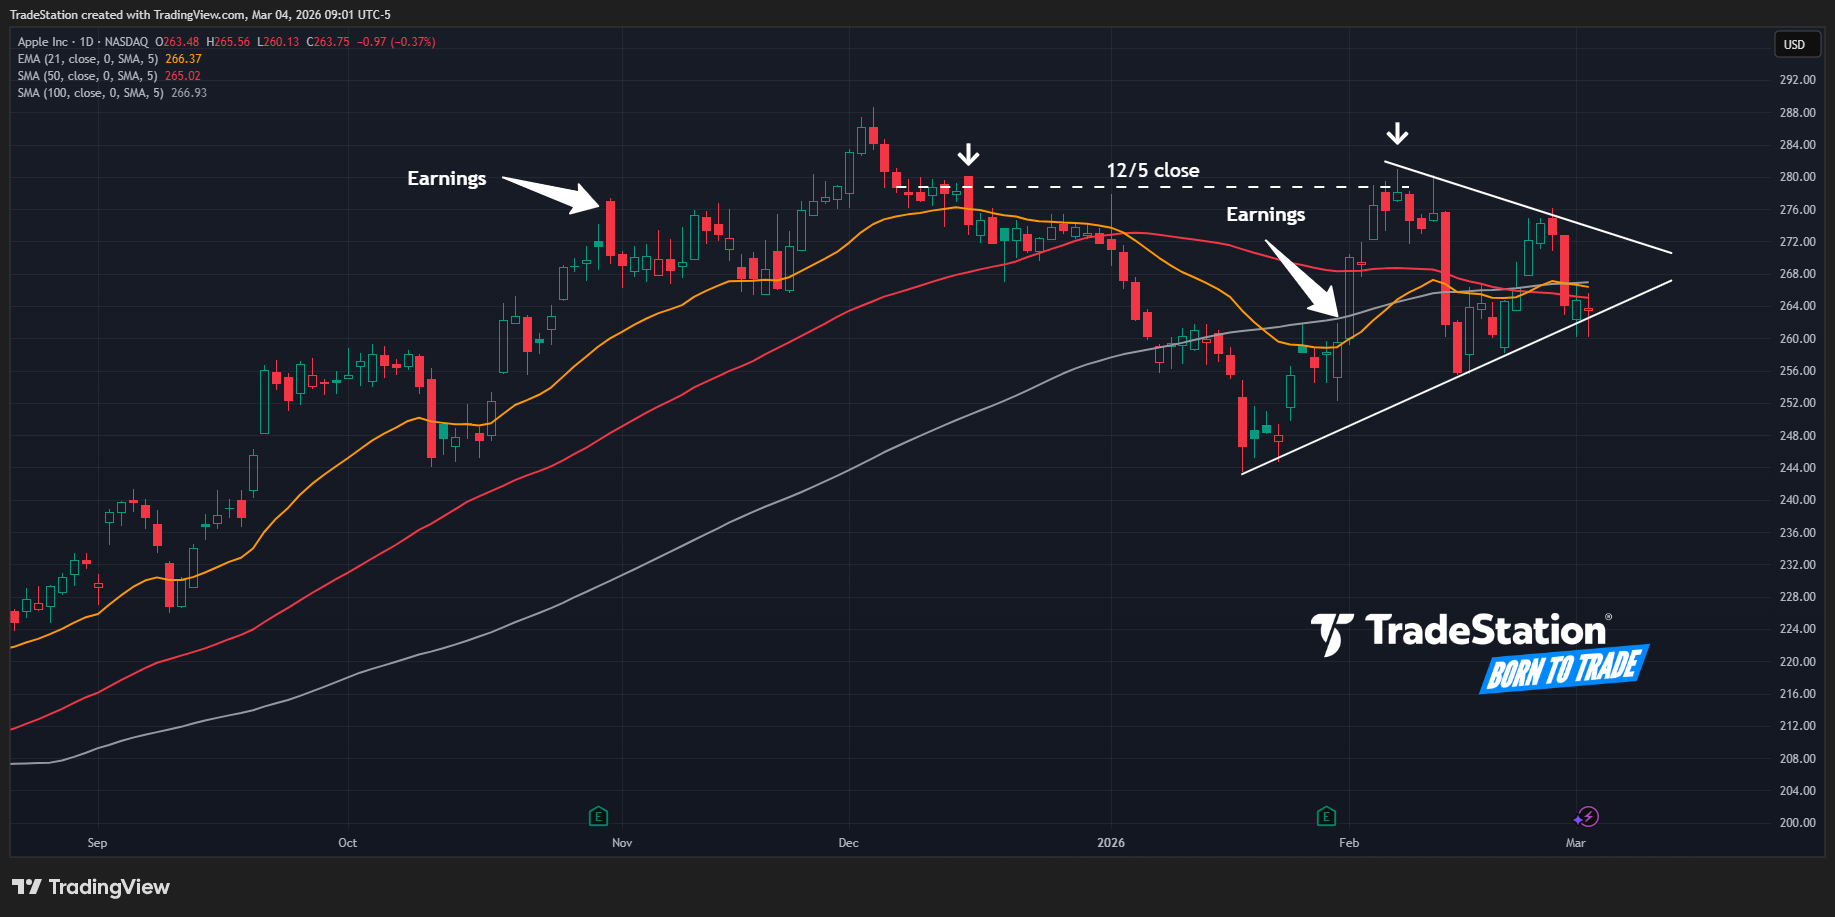
Apple (AAPL), daily chart, with select patterns and indicators, courtesy of TradingView.

The next phase of the AI trade could be taking shape as investors scramble for CPUs and analog chips.

First-quarter earnings season has begun with an explosive move in semiconductor and IT hardware stocks.

Is Oracle finally bottoming? Some traders may think it has.