Key Things to Know as Gold and Silver Hit New Highs

AI Stock ‘Stays Cool’ as Iran War Rages
Vertiv has been a quiet beneficiary of the AI boom and now it’s getting noticed.
Call toll-free 800.328.1267

Gold is having its best year since Jimmy Carter was in office and silver has its biggest gain since the Global Financial Crisis. Today we’ll consider some key products associated with the trend as metals enter the homestretch of 2025.
This table shows the year-to-date performance of key assets like gold, silver and equity products like the S&P 500 and tech stocks. It shows a clear outperformance in metals, despite a big rally in AI stocks.
| Asset | YTD % |
| Silver | +69% |
| Gold | +54% |
| Technology | +25% |
| S&P 500 | +15% |
| Source: TradeStation data |
At least four catalysts have been driving the move:
While it may feel like the rally in gold is sudden, the trend has been taking shape for years. The chart below uses TradeStation’s advanced charting to compare the price of the S&P 500 stock index against the SPDR Gold Trust (GLD), which tracks the metal’s price.
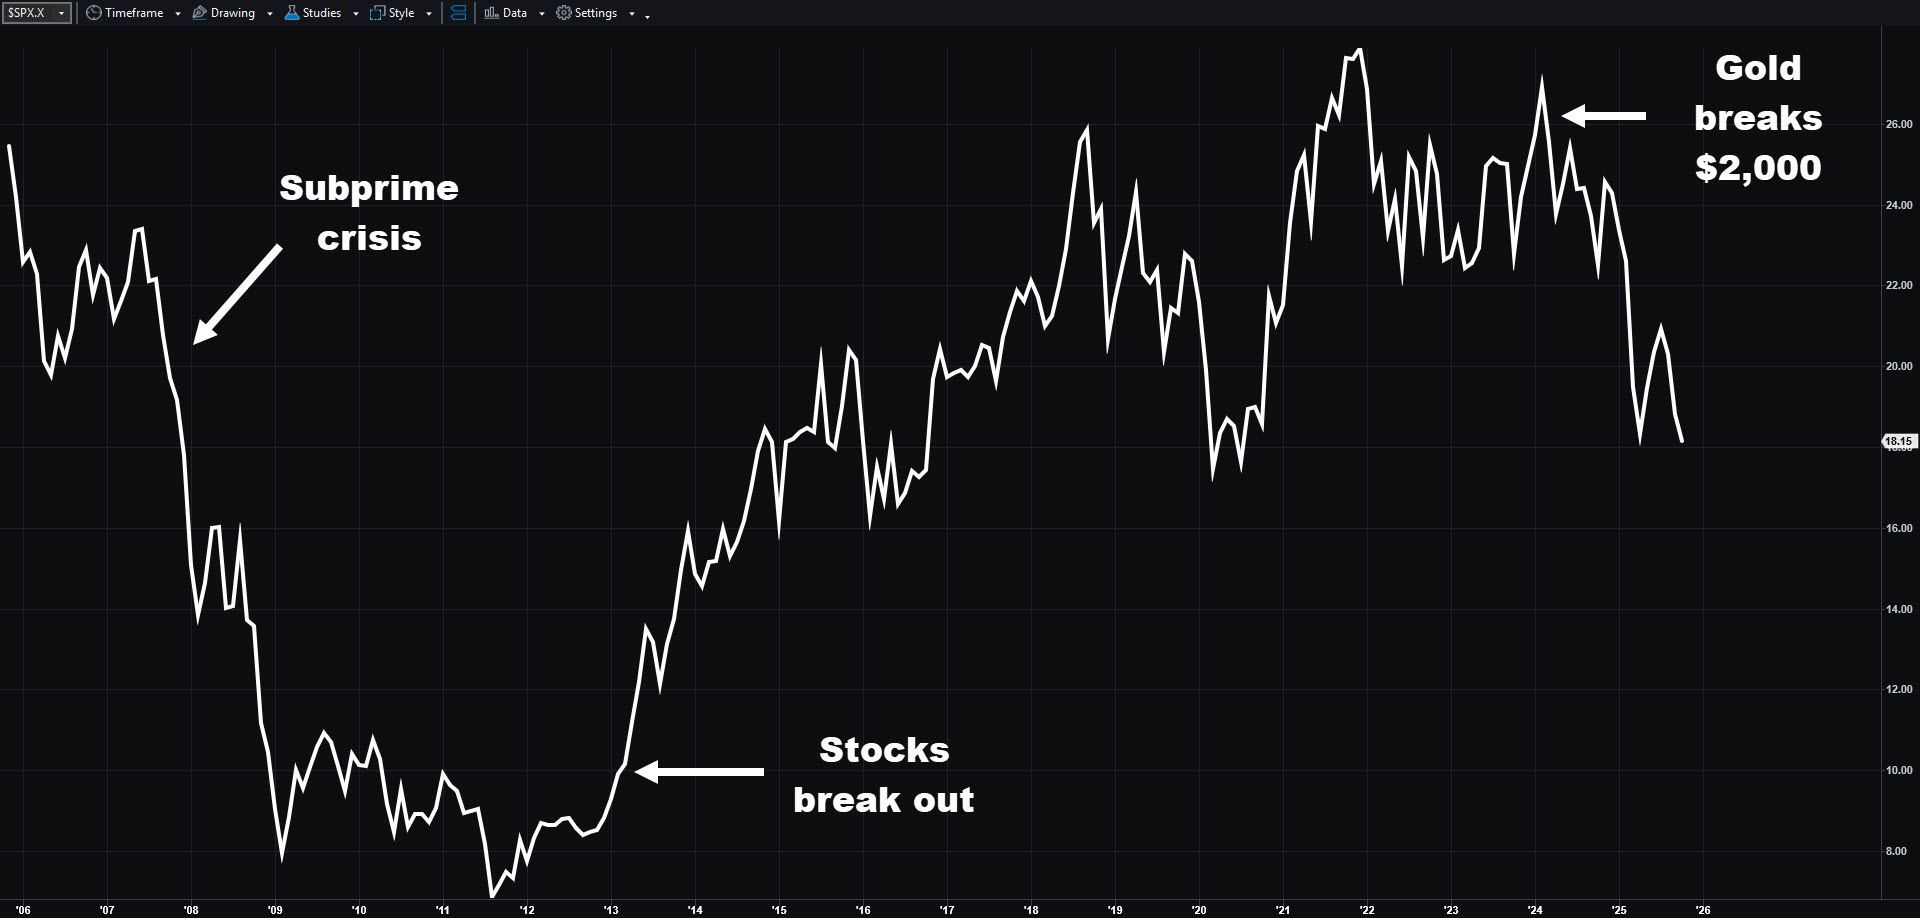
Price ratio of the S&P 500 to the SPDR Gold Trust (GLD), weekly chart, with key events marked.
Notice how the S&P 500 started appreciating relative to gold in October 2011. (That’s when stocks began their recovery from the subprime crisis, followed 1-1/2 years later by a breakout to new highs.) Gold lagged stocks in the following decade, which might be surprising because interest rates were super low. However, there was little political uncertainty and global central banks weren’t active buyers. That was even true during the chaos of the pandemic.
Things changed in early 2022 when the U.S. placed heavy sanctions on Russia and the Fed started hiking interest rates. Gold and stocks both fell in absolute terms, but stocks fell more. The next big event was February 2024, when gold crossed $2,000 for the first time and its rally hasn’t paused since. (Yesterday it crossed $4,000 for the first time.) This year’s percentage change is the highest since 1979.
Gold led the charge in the first phase of the rally, but recent months have seen investors seeking opportunities in other metals.
Such widening is common in financial markets as a new catalyst lifts one or two stocks before widening to others. For example, Nvidia (NVDA) led the current AI boom before other tech stocks like Microsoft (MSFT) and Micron Technology (MU) joined the trend.
Customers looking to participate in the metals trade have alternatives in the stock, options and futures markets.
This table lists equity products, including exchange-traded funds (ETFs), with exposure to metals. These symbols trade actively as stocks and as underliers in the options market. That can help traders use strategies like vertical spreads and covered calls in addition to transacting shares.
| Product | Description | Average Stock Volume |
Average Option Volume |
| SPDR Gold Trust (GLD) | Tracks physical gold prices | 12M | 910,000 |
| iShares Silver Trust (SLV) | Tracks physical silver prices | 25M | 923,800 |
| VanEck Gold Miners ETF (GDX) | Tracks basket of mining companies | 21M | 206,100 |
| Newmont (NEM) | World’s largest gold miner | 10M | 32,000 |
| Barrick Mining (B) | World’s 2nd largest gold miner | 21M | 64,200 |
| Source: TradeStation data |
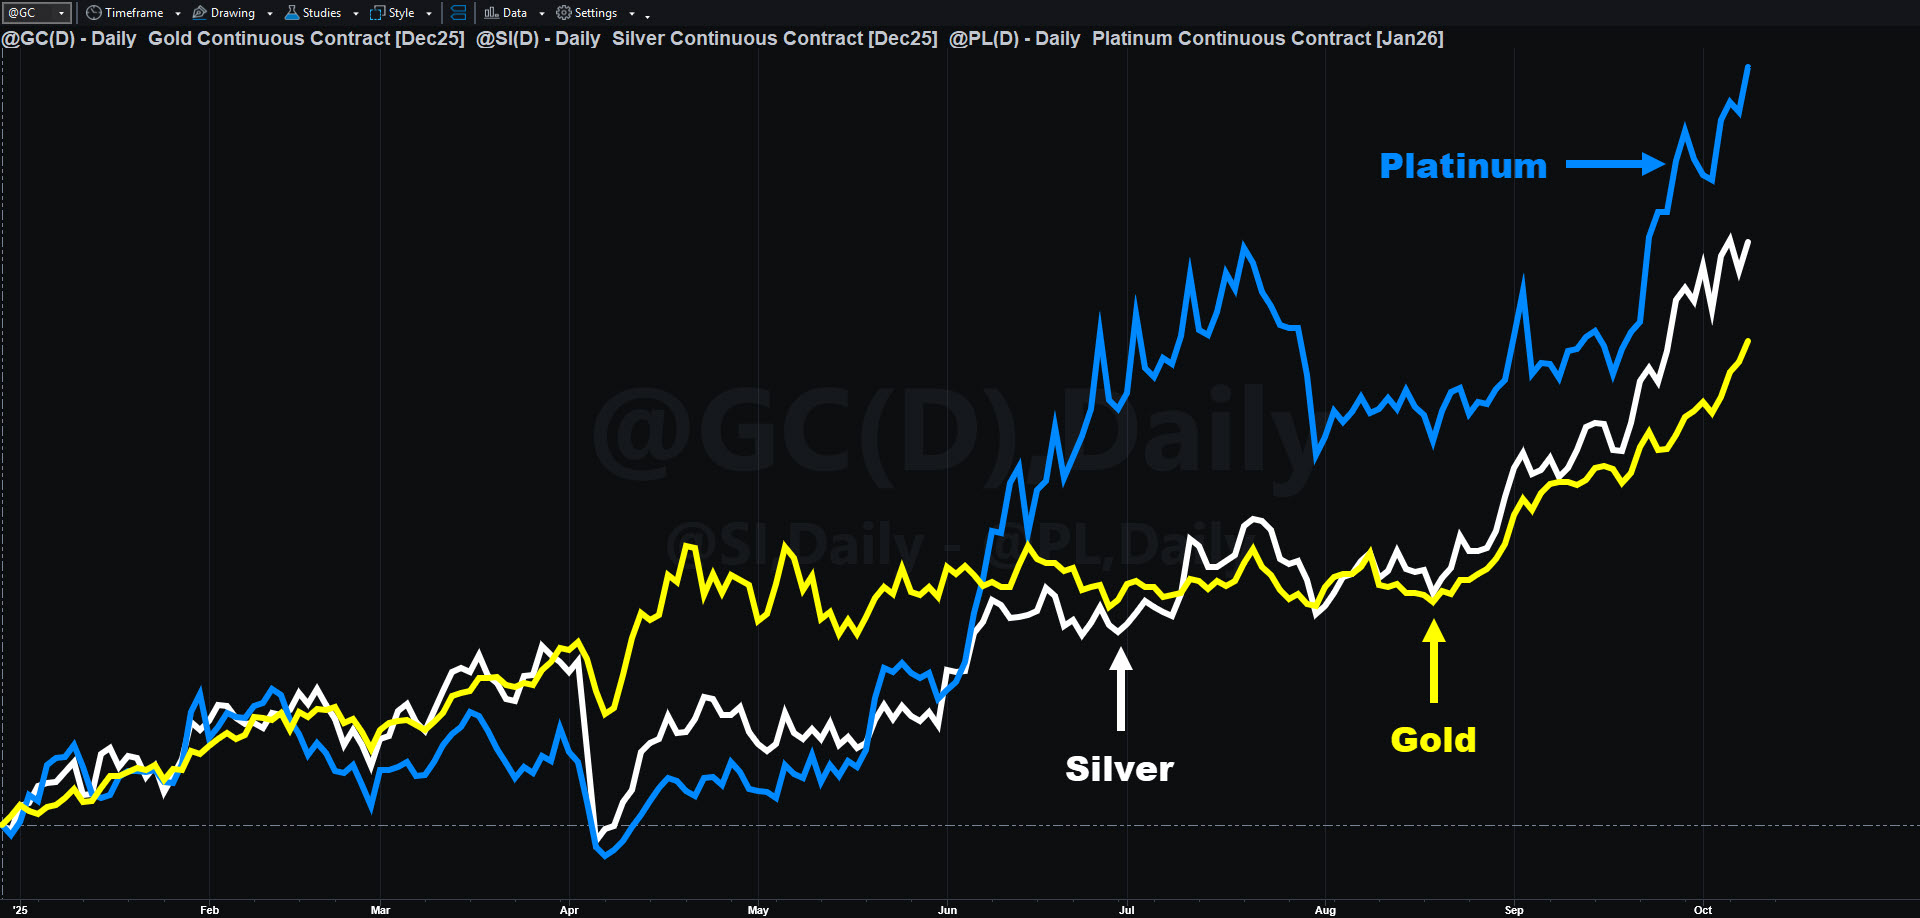
Gold futures (@GC), silver futures (@SI) and platinum futures (@PL), year-to-date-percentage chart.
As commodities, metals like gold and silver also have futures contracts. These are derivatives that track underlying prices, letting traders take long or short positions almost around the clock.
This table lists some of the key futures contracts on metals.
| Product | Perpetual Symbol | Current Month |
| Gold | @GC | December (GCM25) |
| Silver | @SI | December (SIM25) |
| Platinum | @PL | January (PLF26) |
| Palladium | N/A | December (PAZ25) |
| Copper | @HG | December (HGZ25) |
| Source: Tradestation data |
In conclusion, metals like gold and silver are in the midst of historic rallies. Hopefully this article helps you understand some of the ways traders are participating in the moves.
| ETF | 1 Year | 5 Years | 10 Years |
| SPDR Gold Trust (GLD) | +46.25% | +100.69 | +232.65 |
| iShares Silver Trust (SLV) | +49.14% | +95.79% | +205.48% |
| VanEck Gold Miners ETF (GDX) | +91.68% | +95.10% | +456.04% |
| As of September 30, 2025. Based on TradeStation data | |||
Exchange Traded Funds (“ETFs”) are subject to management fees and other expenses. Before making investment decisions, investors should carefully read information found in the prospectus or summary prospectus, if available, including investment objectives, risks, charges, and expenses. Click here to find the prospectus.
Performance data shown reflects past performance and is no guarantee of future performance. The information provided is not meant to predict or project the performance of a specific investment or investment strategy and current performance may be lower or higher than the performance data shown. Accordingly, this information should not be relied upon when making an investment decision.
Futures trading is not suitable for all investors. To obtain a copy of the futures risk disclosure statement visit www.TradeStation.com/DisclosureFutures.
Options trading is not suitable for all investors. Your TradeStation Securities’ account application to trade options will be considered and approved or disapproved based on all relevant factors, including your trading experience. See www.TradeStation.com/DisclosureOptions. Visit www.TradeStation.com/Pricing for full details on the costs and fees associated with options.
Margin trading involves risks, and it is important that you fully understand those risks before trading on margin. The Margin Disclosure Statement outlines many of those risks, including that you can lose more funds than you deposit in your margin account; your brokerage firm can force the sale of securities in your account; your brokerage firm can sell your securities without contacting you; and you are not entitled to an extension of time on a margin call. Review the Margin Disclosure Statement at www.TradeStation.com/DisclosureMargin.

Vertiv has been a quiet beneficiary of the AI boom and now it’s getting noticed.

Stocks are whipsawing after the White House suggested it may de-escalate the Iran war.

Volatility is rising as geopolitical and economic risks increase. How will natural born traders react?