Easier Trading, More Studies Coming to TradeStation's Mobile App

TradeStation is improving the charts on its mobile apps, helping customers follow price action and place orders from their smart phones.
The new interface increases the offering of technical indicators, chart types and timeframes. It also enhances chart-based trading.
More Technical Indicators
The new charts offer more than 100 indicators. The list includes widely used studies like Bollinger Bands, Ichimoku Cloud and Wilder's Relative Strength Index (RSI). More specialized tools are also available, like Donchian Channels, Elder Force Index and the Center of Gravity Oscillator.
Traders can add indicators by tapping the ƒ button at the top of the chart. The resulting view lists studies currently on the chart. Tap "+ Add Indicator" for a list of available studies. They're added to the chart with a single touch. Hit the X at the top left to go back and "+ Add Indicator" again to place additional studies. You can also remove studies with the red X on the right.
Tapping on a study from the Indicator list opens a customization dialog to manage key settings and parameters like lengths and colors.
Aside from offering more studies, the new charts on TradeStation mobile align with TITAN X by allowing unlimited lower studies. (The previous interface only allowed a single lower study.)
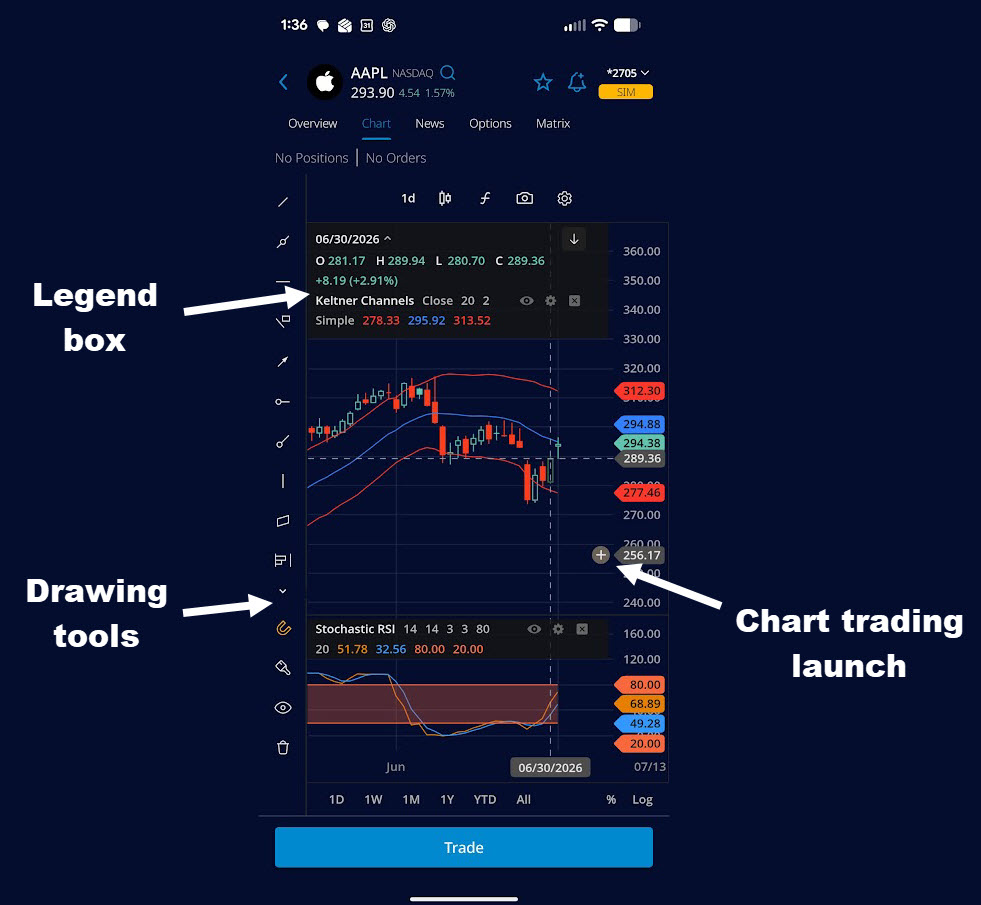
Drawing tools like trendlines and rectangles are available on the left rail. More options can be viewed by swiping up and down.
More Chart Types
The update also increases the number of chart types available to active traders. Tap the chart icon to the left of ƒ to begin. A menu will appear offering these 11 variants:
- Candle: The tips of the lines, or "wicks" mark highs and lows. The thicker body marks the open and close. Red bars indicate that prices closed below the open, and green bars mean that prices closed above where they opened.
- Bar: A vertical line shows the period's range. Its opening price is small horizontal tick on the left of the main line. A small horizontal tick on the right shows the closing price.
- Line: Closing prices are connected in a single line. Opens, highs and lows are not shown.
- Area: Similar to line, but with the underlying space shaded for visual emphasis.
- Equivolume: Bars with more volume are thicker horizontally, helping users connect price action with trading intensity.
- Heikin-Ashi: Smooths price action with average bars. This technique makes trends more visible but omits actual closing prices.
- Scatter: Plots individual price points without connecting them, showing the distribution/dispersion of prices rather than a continuous path.
- Hollow candles: Similar to traditional candles, except positive bars are green and negative bars are red. Bars are hollow when prices close above the open and solid when prices close below the open.
- Histogram: Closing prices are plotted in vertical columns. Green bars indicate the closing or last price is above the open. Red bars denote the opposite.
- Baseline: Prices are plotted relative to a reference level, with different coloring above and below. Users can drag up and down to move the chart relative to the baseline.
- Trend: A simplified line-style rendering focused on the directional movement of price, stripping detail to emphasize the overall trend.
Adjusting Charts
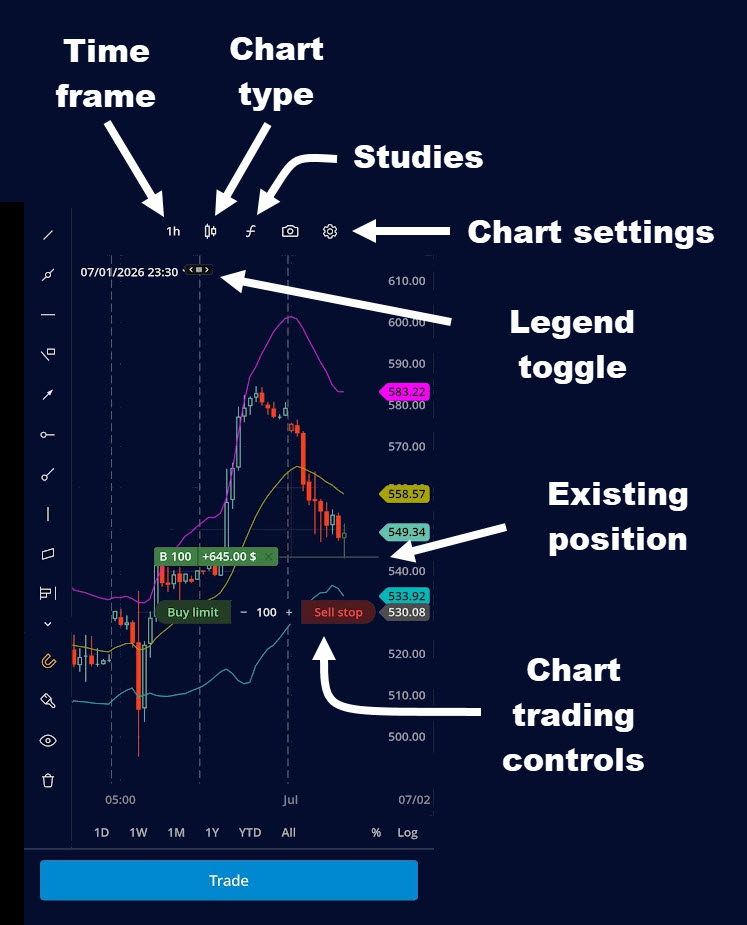
TradeStation customers can now access more time frames by tapping the left button on the controls at the top of the chart. Standard intervals like 1-minute, 5-minute and 1-day are available. Custom intraday intervals can be added with the "+ Add Aggregation" button, which accepts intervals in 1-minute increments. For example, "120" will render two-hour bars.
Charts also have a collapsible legend box that will show key information points (like open, high, low and closing prices) or details on indicators. Traders can open or close it with the caret beside the date/time.
Tapping on the chart will change which candle's values are shown. Holding one's finger on the chart will activate a crosshair.
Users can also adjust the vertical scaling by touching and holding the right axis and pushing up or down.
Tapping the gear at the top right opens a dialog with more chart settings.
Chart Trading
Chart trading is also getting easier if you're looking to place a limit order based on a price level. Simply touching the chart will make a small + appear on the right axis. Tapping the + will activate pill-like controls for placing a limit or stop order at the price. This widget will conveniently pass the price and size to the order ticket at the bottom of the app.
Getting Started
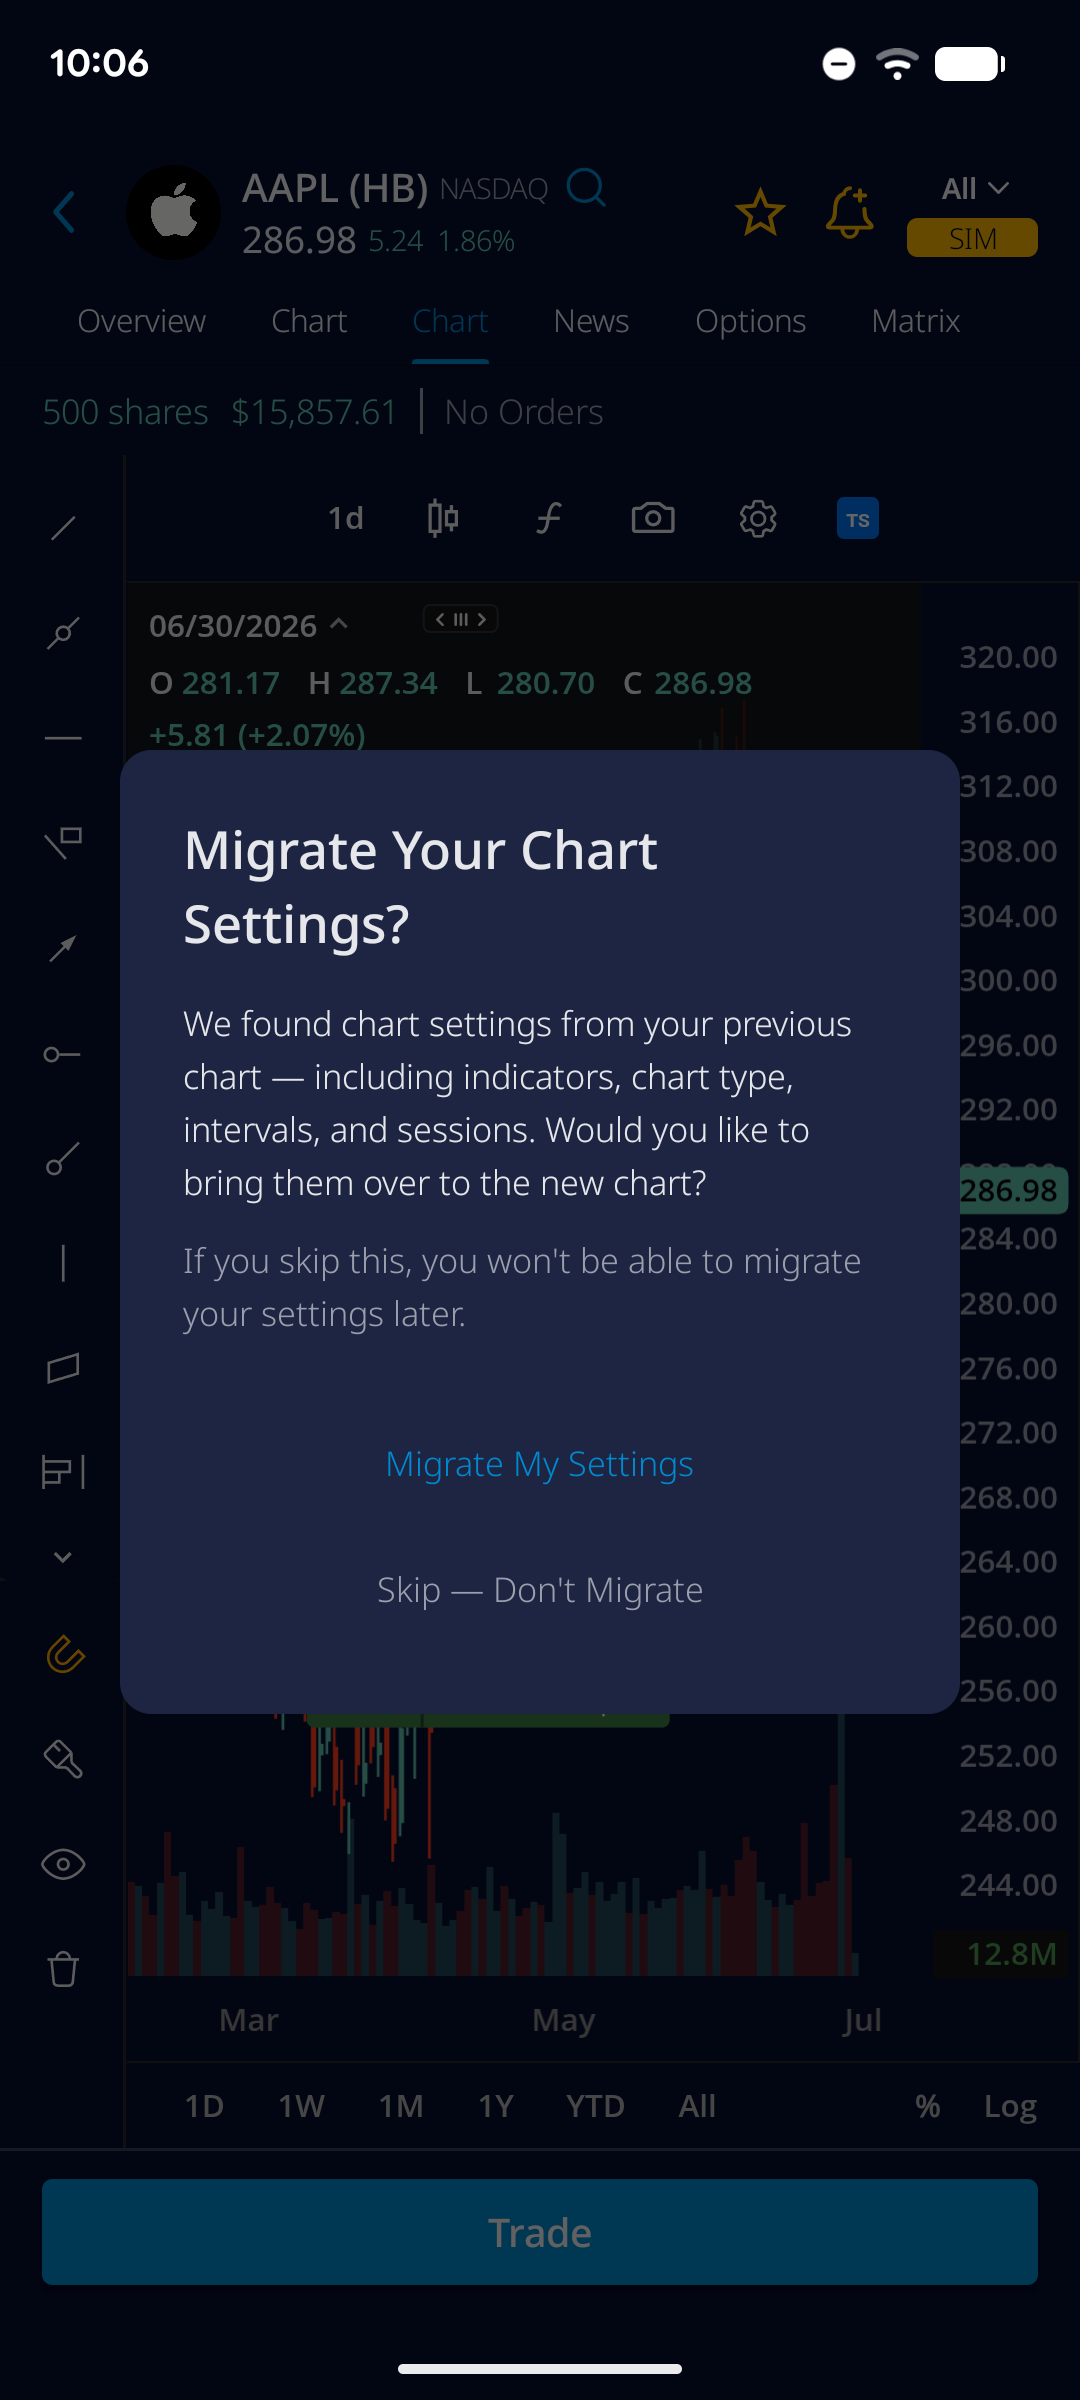
The new charts will become available in stages this month. Customers can look for notification in a brief "What's New" message. Many traders have spent time and effort configuring charts, so our developers created a tool to transfer settings (like indicators) from the old system. This option will also appear the first time customers access the new system, although users should still check to ensure settings have transferred correctly.