Chart of the Day: A Top for Tesla?

Call Volume Spikes: Has Oracle Bottomed?
Is Oracle finally bottoming? Some traders may think it has.
Call toll-free 800.328.1267

Tesla ended the third quarter on a strong note, but some traders may see risk of the EV maker stalling.
The first pattern on today’s chart is the $463 price area. TSLA peaked at that level twice last December before reversing lower. Sellers appeared around the same level this month, which may confirm …
For more, please click here to view the related idea and chart analysis on TradingView.
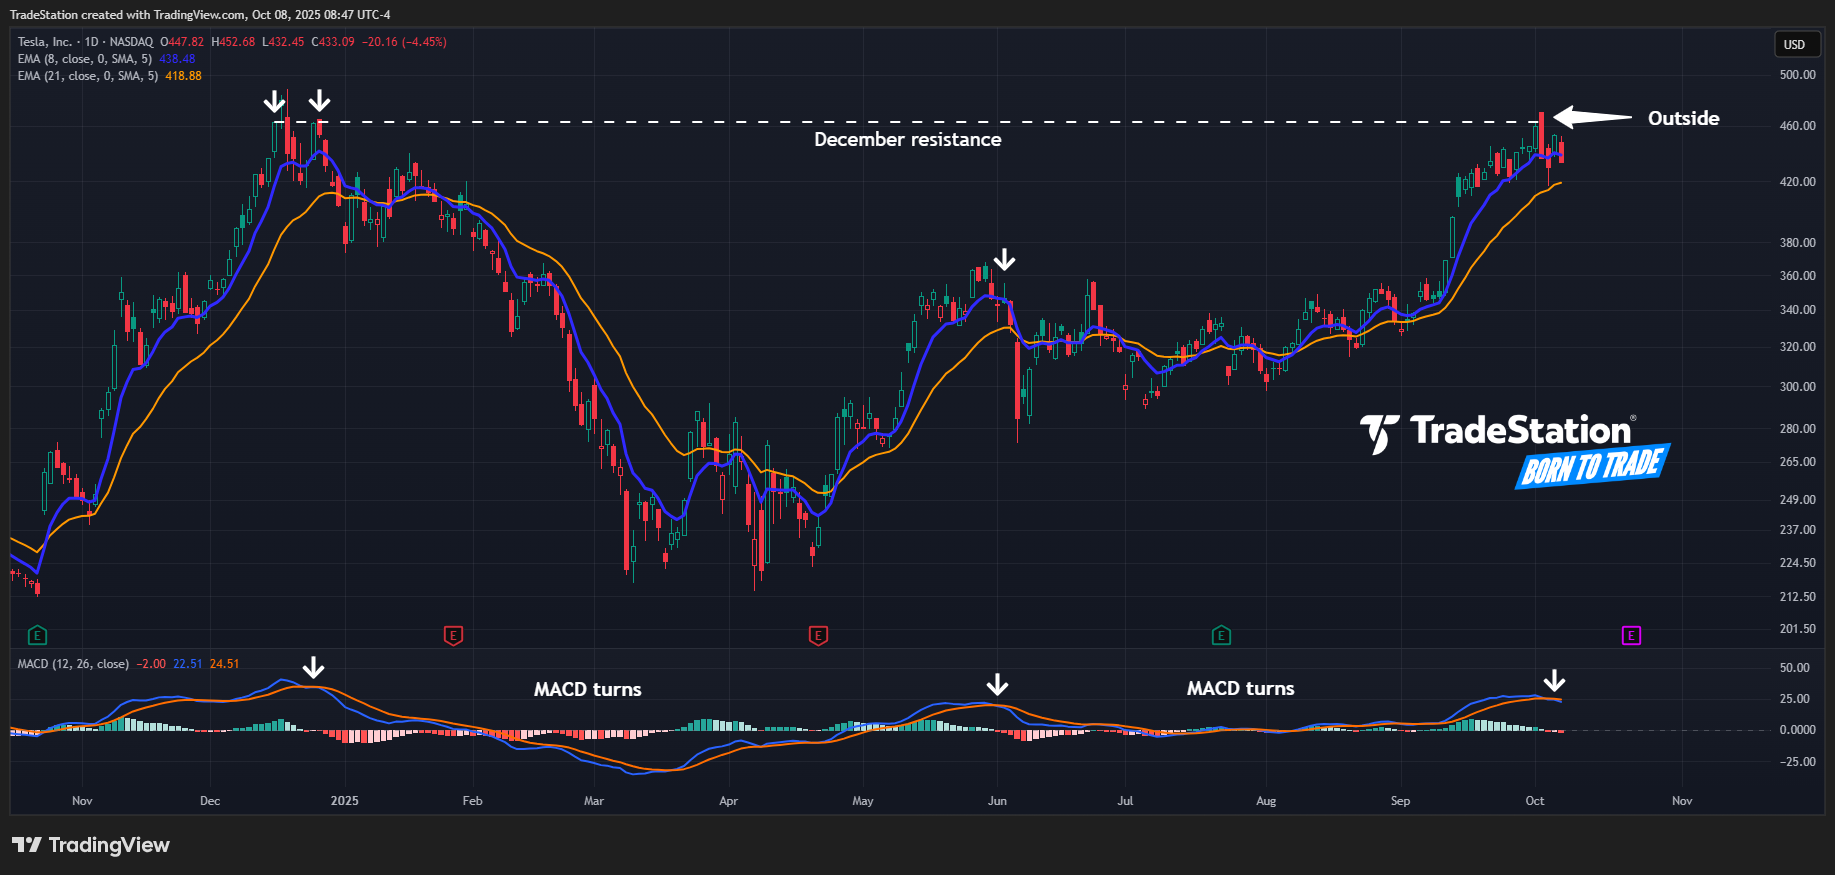
Tesla (TSLA), daily chart, with selected patterns and indicators, courtesy of TradingView.

Is Oracle finally bottoming? Some traders may think it has.

Nebius consolidated for months, but some traders may think the datacenter stock is breaking out. The first pattern on today’s chart is the long basing pattern between November and late March. (It could also be viewed as a cup and handle following the rally between...

Chipmakers are trying to break out as investors brace for a potential oil shock.