Assessing the Market With Sector Performance

Insights AI: A Partner for Active Traders
Active traders are always studying headlines and price moves. TradeStation now has a machine-powered tool to make that process easier.
Call toll-free 800.328.1267

Market internals is a field of technical analysis that considers how companies within the stock market are performing. A recent article covered breadth, and now we’ll turn to sector performance.
This technique assesses the S&P 500 by comparing price changes of different constituent groups like technology, energy and financials. Are investors favoring “risk-on” stocks that are consistent with a bullish market? Or are they hiding in “safe havens?” Answering such questions can help confirm or invalidate moves higher and lower. Here are a few ways to think about sector performance.
First, sector performance can help distinguish between “growth” and cyclical market conditions. Companies like Nvidia (NVDA), Apple (AAPL) and Microsoft (MSFT) are normally considered growth stocks because their businesses are newer and gaining wider adoption as end-markets expand. On the other hand, firms like JPMorgan Chase (JPM) and Caterpillar (CAT) are economically sensitive. Their results often benefit when the business cycle accelerates and struggle when recessions occur, which makes them cyclical. (The same can be true for materials.) They’re also commonly called “value stocks” because such companies tend to have lower multiples than growth stocks.
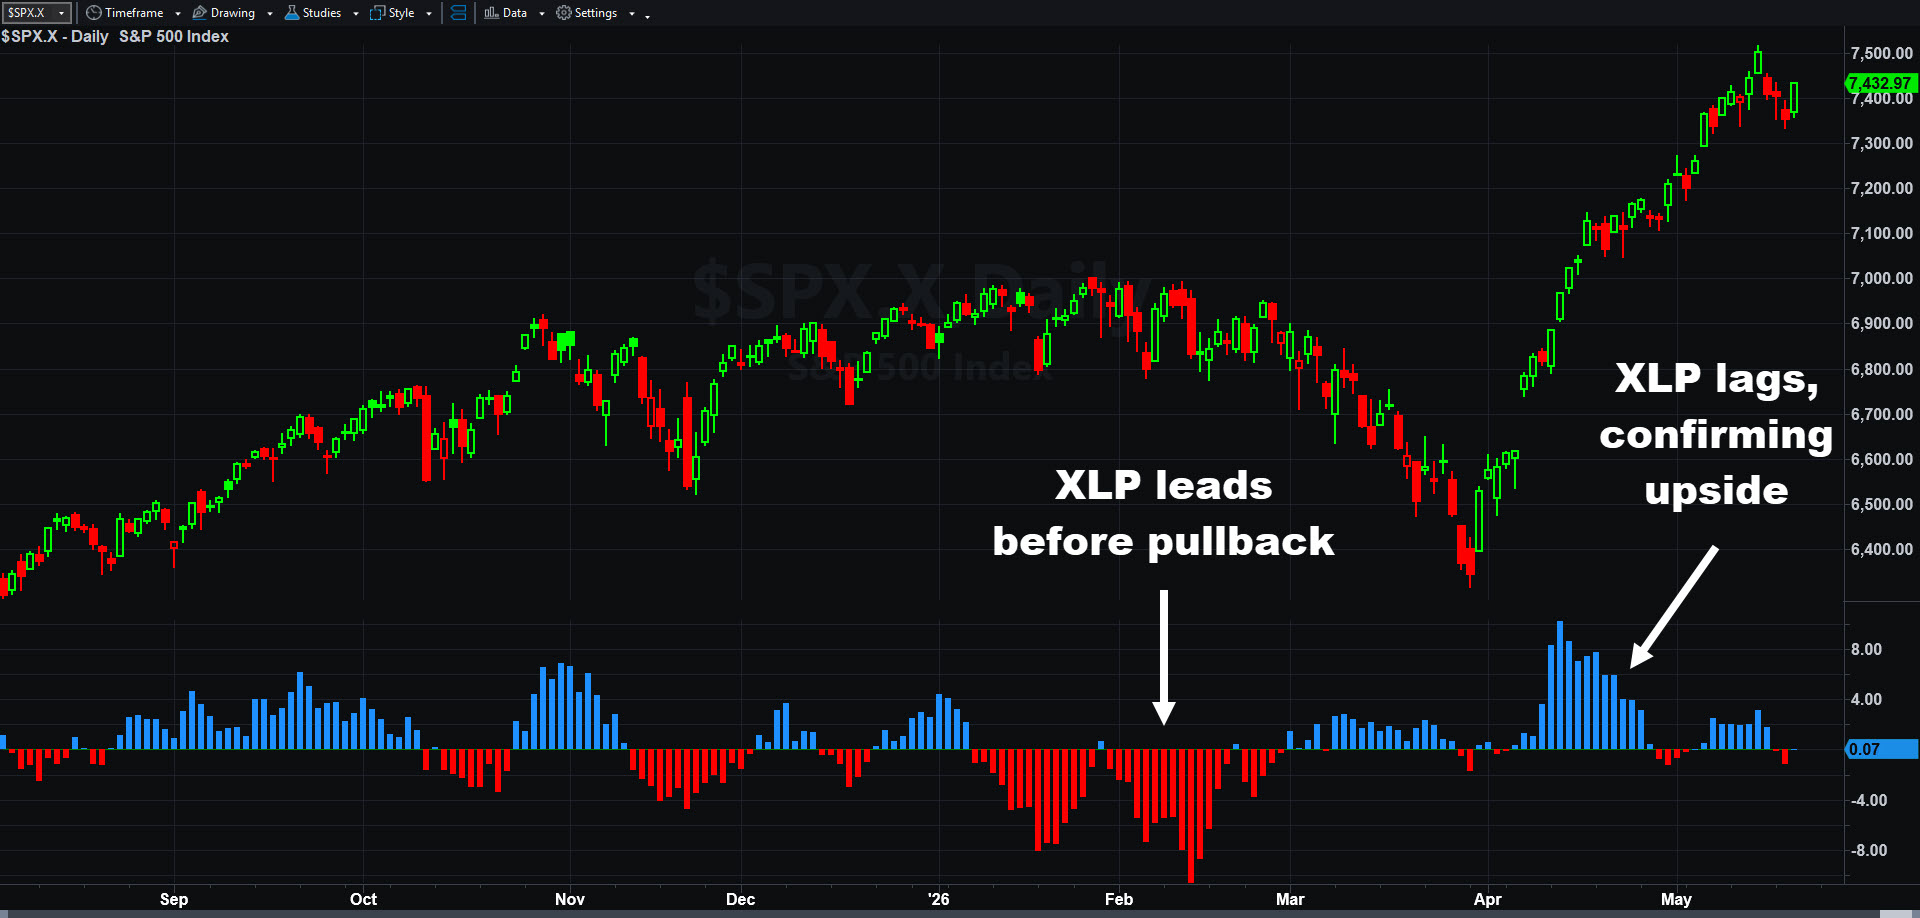
S&P 500 vs Consumer Staples Select Sector ETF (XLP). Prices as of May 20, 2026.
Most investors probably know that large growth stocks like NVDA have dominated performance in recent years. Given their size, they often pull the market higher or drag it lower. Sector performance can also help us follow such key stocks. They’re mostly concentrated in three sectors, tracked by these ETFs:
Investors may look for strength in these three sectors to confirm a bullish move in the market. Likewise, they may expect a pullback when the growth sectors lag. This pattern applied in late 2021 and early 2022 as a bear market took hold. It also applied in early 2026 before the market pulled back.
Sector performance can also foreshadow potential drops if investors monitor “safe-havens” like consumer staples. This group, tracked by the Consumer Staples Select Sector ETF (XLP), includes companies like Costco (COST), Procter & Gamble (PG) and Coca-Cola (KO). Safe havens often lag in a rising market. They sometimes take leadership toward the end of a bullish move as investors stop buying leaders like big tech or economically sensitive stocks like financials.
Traders may therefore look for relative weakness in XLP to confirm a bull market. Strength in the group may indicate a pullback is coming.

Customize indicator dialog for Relative Strength study on charts. Key options are marked.
Customers looking to analyze sector performance on charts can use the relative strength indicator, which compares the percentage changes of different securities:
RadarScreen™ can track multiple sectors over multiple time frames to detect shifts in performance and relative strength. (See this article for more.)
In conclusion, sector performance can help traders assess the market’s strength and leadership. It can also provide warnings for potential weakness. Hopefully this article helps you apply it to your charts and other tools.
| ETF | 1 Year | 5 Years | 10 Years |
| SPDR S&P 500 ETF (SPY) | +29.60 | +72.22% | +248.31% |
| Materials Select Sector SPDR ETF (XLB) | +22.69% | +23.96% | +118.56% |
| Communication Services Select Sector SPDR ETF (XLC) | +22.08% | +49.28% | +233.02% * |
| Energy Select Sector SPDR ETF (XLE) | +48.20% | +141.50% | +81.58% |
| Financial Select Sector SPDR ETF (XLF) | +6.91% | +43.77% | +175.38% |
| Industrial Select Sector SPDR ETF (XLI) | +33.04% | +71.27% | +210.86% |
| Technology Select Sector SPDR ETF (XLK) | +51.92 | +128.35% | +657% |
| Consumer Staples Select Sector SPDR ETF (XLP) | +3.03% | +21.17% | +61.20% |
| Real Estate Select Sector SPDR ETF (XLRE) | +7.51% | +3.81% | +41.49% |
| Utilities Select Sector SPDR ETF (XLU) | +18.76% | +40.44% | +93.52% |
| Health Care Select Sector SPDR (XLV) | +3.93% | +20.32% | +111.61% |
| Consumer Discretionary Select Sector SPDR ETC (XLY) | +19.99% | +32.29% | +198.86% |
| As of April 30, 2026. Based on TradeStation Data. *- Return since inception |
|||
Exchange Traded Funds (“ETFs”) are subject to management fees and other expenses. Before making investment decisions, investors should carefully read information found in the prospectus or summary prospectus, if available, including investment objectives, risks, charges, and expenses. Click here to find the prospectus.
Performance data shown reflects past performance and is no guarantee of future performance. The information provided is not meant to predict or project the performance of a specific investment or investment strategy and current performance may be lower or higher than the performance data shown. Accordingly, this information should not be relied upon when making an investment decision.
ID5515100 D0526

Active traders are always studying headlines and price moves. TradeStation now has a machine-powered tool to make that process easier.
An overview of TradeStation TITAN X trading tools, including chart-based order entry, OCO functionality, and integrated risk management features.

TradeStation’s platform is known for letting customers build their own tools. It also provides a series of calculated indexes for advanced technical analysis.