Chart of the Day: Potential Breakout in Apple

Netflix Falters as AI Lifts Other Stocks
Netflix has struggled as AI trades dominate the market. Is the long-term growth stock finally stalling?
Call toll-free 800.328.1267

Apple has been snoozing for months, but there could be signs of a breakout
The first pattern on today’s chart is $278.85, the final price on November 28. AAPL probed that weekly level a few times but was unable to end a week above it until last Friday, May 4. Closing above it may suggest a longer-term breakout is taking place.
Second, the tech giant held its rising …
For more, please click here to view the related idea and chart analysis on TradingView.
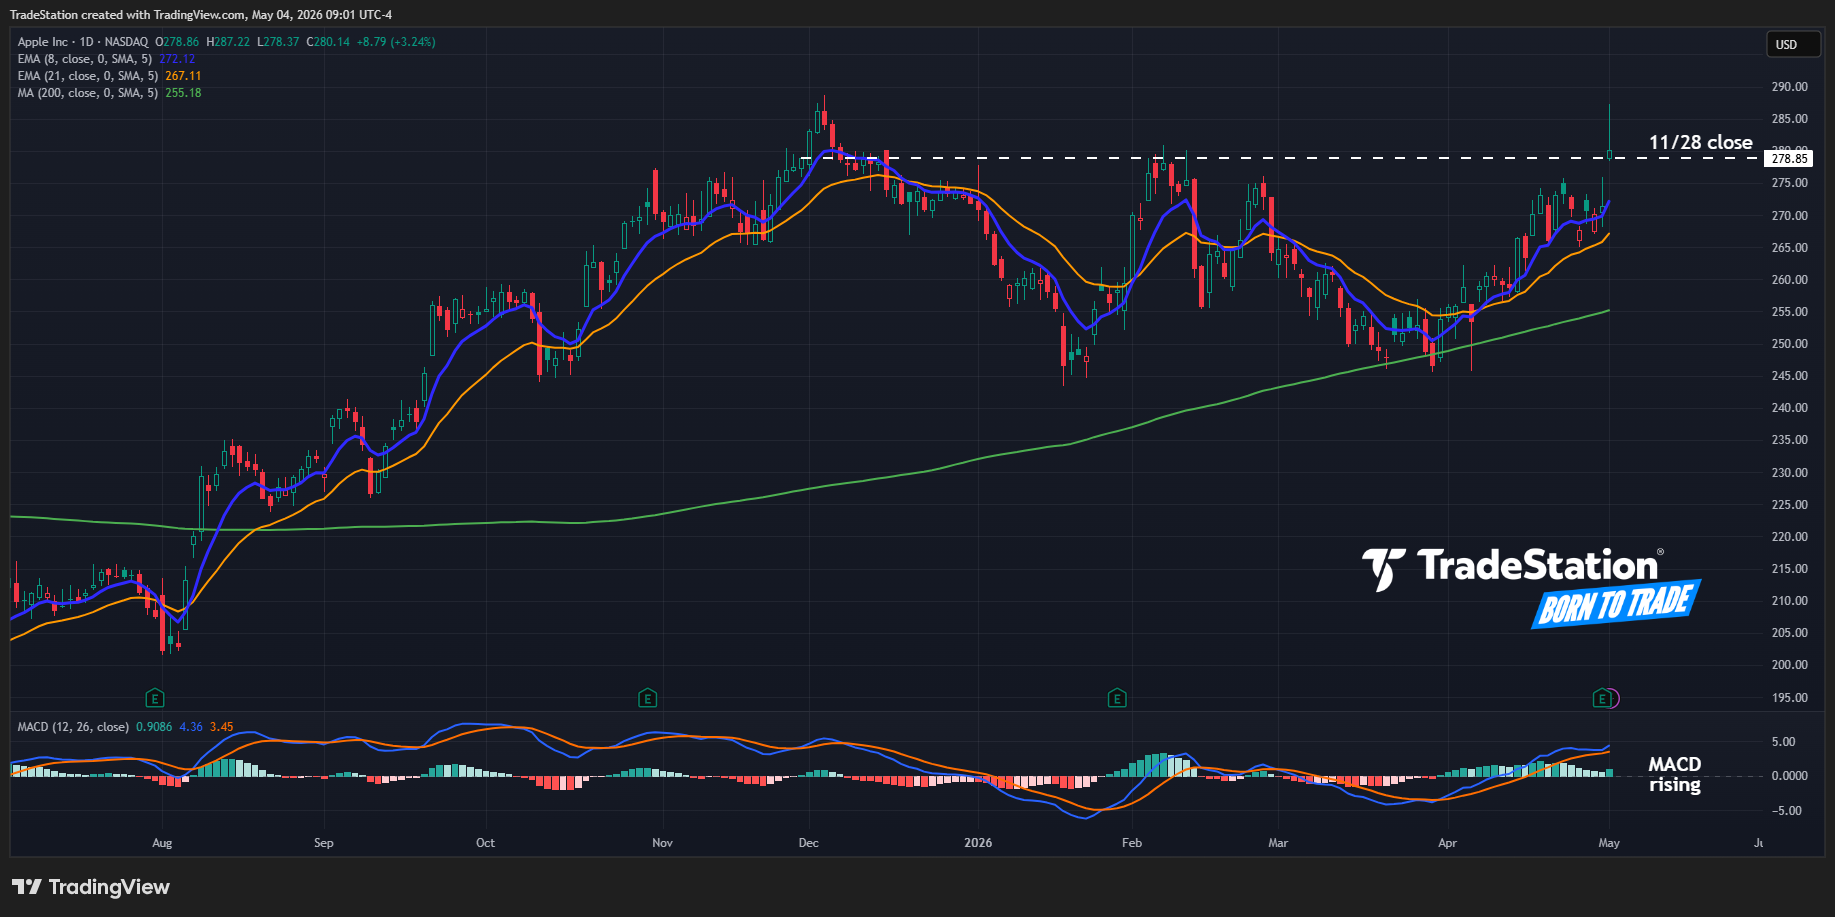
Apple (AAPL), daily chart, with select patterns and indicators, courtesy of TradingView.

Netflix has struggled as AI trades dominate the market. Is the long-term growth stock finally stalling?

The Nasdaq-100 keeps running as the AI boom widens across the technology sector.

Amazon.com is fighting to new highs, and one big options trader seems to expect a bigger move.