Chart of the Day: Potential Breakout in Nebius

Call Volume Spikes: Has Oracle Bottomed?
Is Oracle finally bottoming? Some traders may think it has.
Call toll-free 800.328.1267

Nebius consolidated for months, but some traders may think the datacenter stock is breaking out.
The first pattern on today’s chart is the long basing pattern between November and late March. (It could also be viewed as a cup and handle following the rally between March and October.)
Second, prices remained above the …
For more, please click here to view the related idea and chart analysis on TradingView.
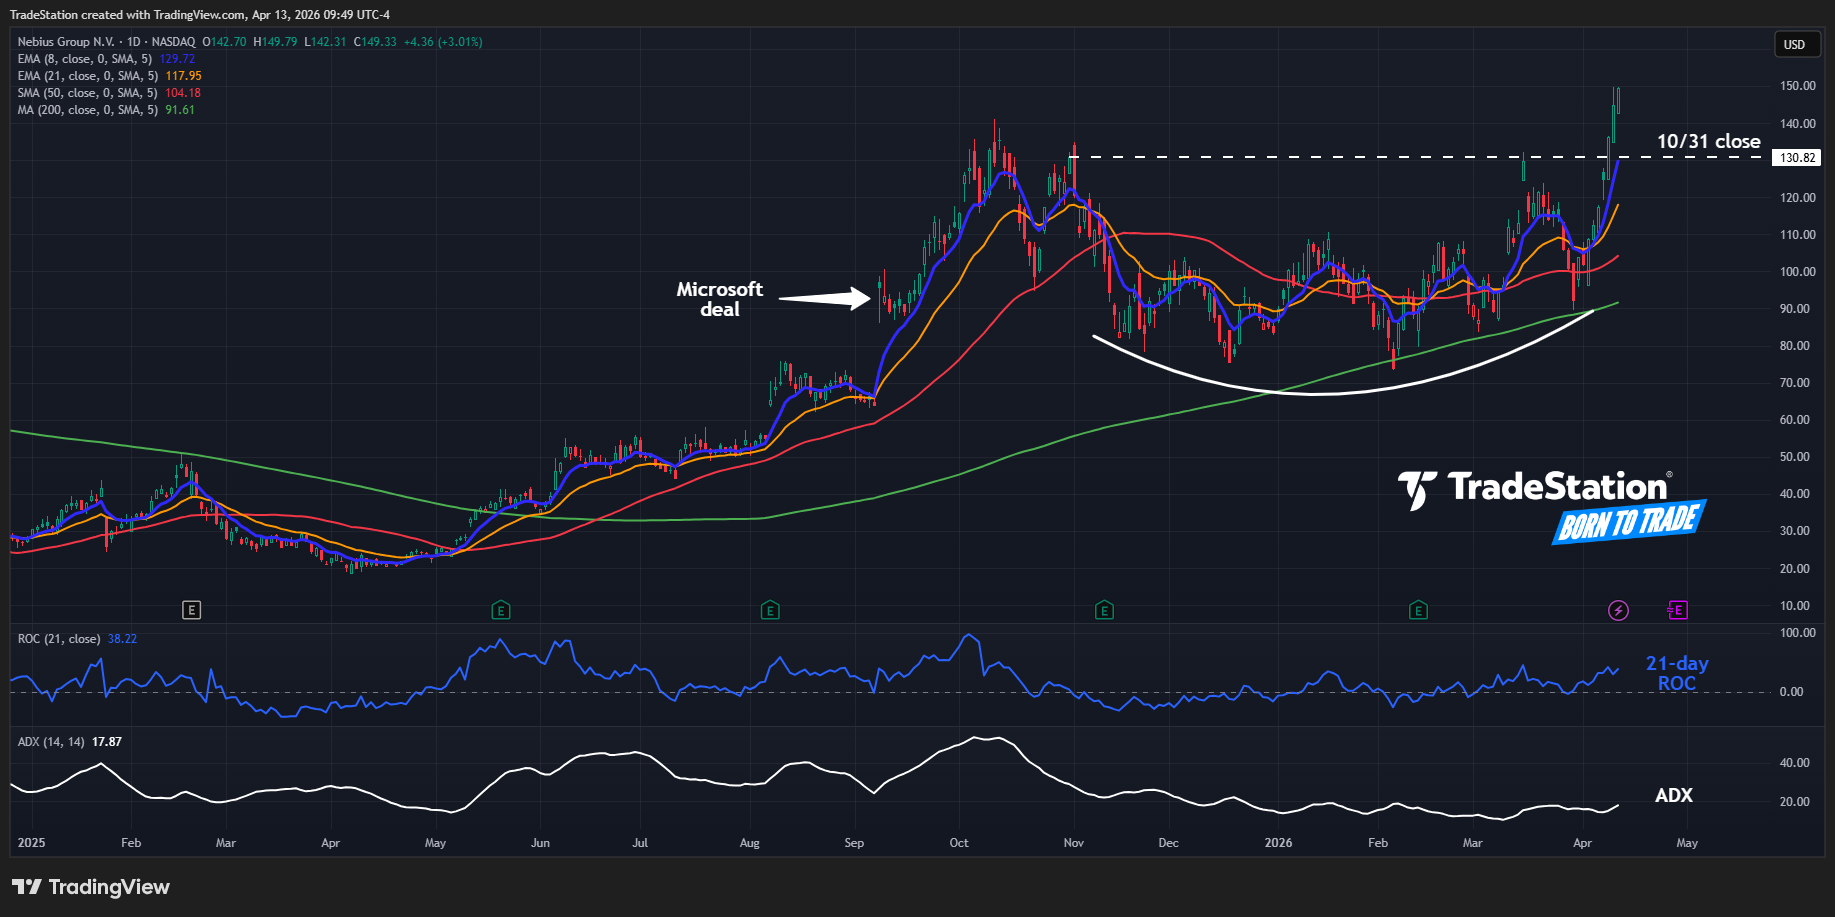
Nebius (NBIS), daily chart, with select patterns and indicators, courtesy of TradingView.

Is Oracle finally bottoming? Some traders may think it has.

Chipmakers are trying to break out as investors brace for a potential oil shock.

Stocks face big tests as investors watch for signs of the Hormuz crisis improving.