Chart of the Day: Best Buy’s Lower Highs

Chips Lead as Big Tech Earnings Begin
First-quarter earnings season has begun with an explosive move in semiconductor and IT hardware stocks.
Call toll-free 800.328.1267

Best Buy fell sharply on “Liberation Day.” Now, after a modest rebound, some traders may see further downside risk.
The first pattern on today’s chart is July 10’s peak of $74.75. That was below the June high, which in turn was under May’s high. Such a succession of lower …
For more, please click here to view the related idea and chart analysis on TradingView.
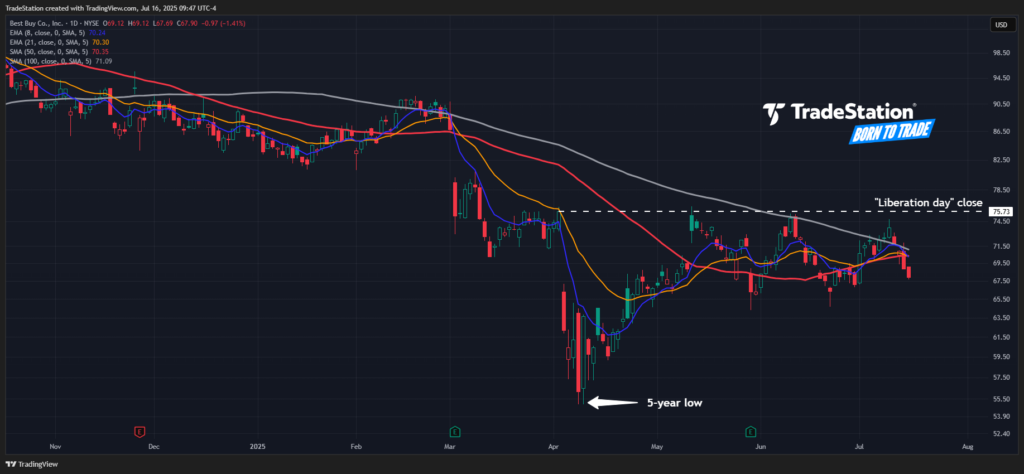
Best Buy (BBY), daily chart, with selected patterns and indicators, courtesy of TradingView.

First-quarter earnings season has begun with an explosive move in semiconductor and IT hardware stocks.

Is Oracle finally bottoming? Some traders may think it has.

Nebius consolidated for months, but some traders may think the datacenter stock is breaking out. The first pattern on today’s chart is the long basing pattern between November and late March. (It could also be viewed as a cup and handle following the rally between...