July Starts with a Bang as Tech Breaks Out

Stocks Climb as AI Demand Shifts to CPUs, Analog
The next phase of the AI trade could be taking shape as investors scramble for CPUs and analog chips.
Call toll-free 800.328.1267

Stocks are beginning the second half with a bang, led by the biggest and most followed sector.
The S&P 500 rose 1.7 percent in the holiday-shortened week between Friday, June 27, and Thursday, July 3. The index closed above 6,200 for the first time ever, with 82 percent of its member stocks advancing.
The rally followed June 24’s breakout in technology, which accounts for almost one-third of the S&P 500. Semiconductor giants like Nvidia (NVDA) and Broadcom (AVGO) have spurred the move as investors look for continued AI investment to drive growth. Other events have also helped companies in the tech sector:
| First Solar (FSLR) | +22% |
| Hewlett-Packard Enterprise (HPE) | +16% |
| Oracle (ORCL) | +13% |
| Moderna (MRNA) | +12% |
| Wynn Resorts (WYNN) | +12% |
| Source: TradeStation data |
There were several other positive developments outside of technology.
First, economic data didn’t confirm fears of a potential recession. Manufacturing and service-sector indexes from the Institute for Supply Management beat estimates as activity and orders improved. Initial jobless claims fell more than expected to a six-week low. Non-farm payrolls also surprised to the upside, while unemployment was lower than expected. Wage growth was moderate.
In other words, the economy continues to avoid a slowdown, the job market isn’t breaking and inflationary pressures seem muted. Those conditions maintained hopes for the Federal Reserve to cut interest rates in September, according to calculations by CME’s FedWatch tool. It’s a potentially positive environment that supports earnings growth and lower borrowing costs.
Investors reacted by turning the most positive (45 percent) since December, according to the American Association of Individual Investors.
There was also bullish price action in cyclical stocks that benefit from a stronger economy. Materials, for example, were the top sector last week. Packaging Corp. of America (PKG) led the group after announcing an acquisition that’s expected to boost earnings immediately.
Financials broke out to new highs a week after major banks passed the Fed’s “stress tests.” That clean bill-of-health will let companies return more capital to shareholders in the form of dividends and stock buybacks. Separately, Morgan Stanley said the industry may benefit from increased Wall Street activity like deal making and securities underwriting.
Travel stocks jumped after Carnival (CCL) beat estimates. Strong monthly gaming revenue from Macau boosted casinos operators like Wynn Resorts (WYNN) and Las Vegas Sands (LVS).
Ford Motor (F) had its biggest weekly gain in two years after announcing that vehicle sales rose 14 percent in the second quarter. The automaker also gained 1.8 percentage points of market share.
| Centene (CNC) | -39% |
| Molina Healthcare (MOH) | -19% |
| Elevance Health (ELV) | -8.8% |
| Expand Energy (EXE) | -8.4% |
| Williams (WMB) | -6.4% |
| Source: TradeStation data |
Interestingly, global stocks barely rose last week. The group has essentially flatlined in the last month after outperforming domestic stocks by a wide margin in the first half. Could they face additional risk with President Trump threatening tariffs on Europe as high as 50 percent starting this Wednesday, July 9?
Health insurers remain a weak spot in the market. Centene (CNC) had its biggest weekly drop ever after saying medical costs were higher than expected. Related company Molina Healthcare (MOH) also fell. The news was similar to developments in UnitedHealth (UNH) in April and May, with increased usage of medical services squeezing profits.
The S&P 500 ended last Thursday with its second consecutive weekly closing high. Some indicators reflect potentially bullish technicals.
First, new highs on the advance/decline line may confirm the breakout.
Second, the moving average convergence-divergence (MACD) has started rising again. That’s potentially consistent with short-term strength.
Third, the number of index’s members above their respective 200-day moving averages has risen to its highest total since late January. That could indicate more stocks are participating to the upside.
Next, the index has risen in seven of the last nine days. Given that relatively steady advance, traders may see limited downside risk. They could potentially look for support above Wednesday’s high of 6228.
Cboe’s Volatility Index (VIX) has also returned to levels seen in mid-February, before tariffs hammered sentiment. Lower readings sometimes correspond with smaller moves in the broad index and more opportunity at the individual-stock level.
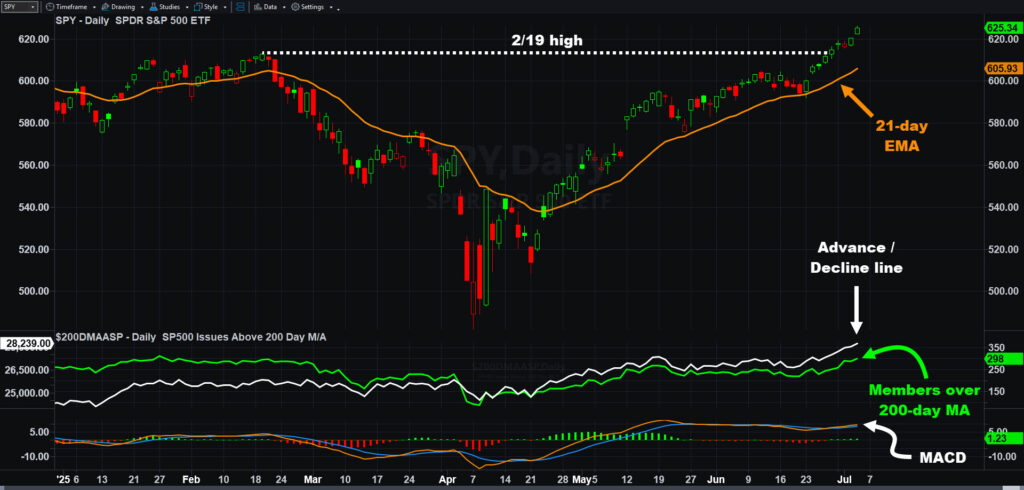
SPDR S&P 500 ETF (SPY), daily chart with select patterns and indicators.
This week is relatively quiet. Still, some unscheduled events may impact sentiment.
OPEC+ met yesterday, which could potentially affect energy stocks today.
Nothing important is scheduled for tomorrow. It’s also one day before an announced tariff increase, which could place traders on edge for potential announcements from the White House
Wednesday brings crude oil inventories and minutes from the last Fed meeting.
Initial jobless claims are on Thursday, along with earnings from Conagra (CAG).
Next week marks the beginning of earnings season. That could increase the likelihood of companies preannouncing results or analysts issuing important research notes.
| ETF | 1 Year | 5 Years | 10 Years |
| SPDR S&P 500 (SPY) | +13.53% | +100.37% | +200.15% |
| As of June 30, 2025. Based on TradeStation data | |||
Exchange Traded Funds (“ETFs”) are subject to management fees and other expenses. Before making investment decisions, investors should carefully read information found in the prospectus or summary prospectus, if available, including investment objectives, risks, charges, and expenses. Click here to find the prospectus.
Performance data shown reflects past performance and is no guarantee of future performance. The information provided is not meant to predict or project the performance of a specific investment or investment strategy and current performance may be lower or higher than the performance data shown. Accordingly, this information should not be relied upon when making an investment decision

The next phase of the AI trade could be taking shape as investors scramble for CPUs and analog chips.

First-quarter earnings season has begun with an explosive move in semiconductor and IT hardware stocks.

Is Oracle finally bottoming? Some traders may think it has.