Massive Volatility as Trump Signals De-Escalation

Volatility Is Rising. How Do Born Traders React?
Volatility is rising as geopolitical and economic risks increase. How will natural born traders react?
Call toll-free 800.328.1267

Stocks are whipsawing after the White House suggested it may de-escalate the Iran war.
S&P 500 futures were down more than 1 percent this morning, but jumped more than 3 percent after President Trump said the U.S. would postpone strikes against Iranian energy assets for five days. The move seemed to reverse a threat on Saturday evening to attack facilities tonight if the Strait of Hormuz isn’t reopened.
The market’s swings are consistent with a pattern of volatility as investors assess risks from the war — especially the impact on inflation and interest rates. For example last week, the S&P 500 rose almost 2 percent on Monday and part of Tuesday. If the index had stayed there, it would have been the best week since Thanksgiving. But prices stalled and dropped sharply through Friday afternoon, ending the week down 1.9 percent. Two thirds of its member stocks fell, along with nine of the 11 major sectors.
Attention has increasingly focused the risk of a bigger crisis if traffic from the Persian Gulf isn’t restored.
“The patience of the oil market, the sort of trust or benefit of the doubt, goes out the window, and we just reprice higher and higher,” energy analyst John Kilduff said in a podcast on Friday. By early April, “you’ll be hearing about real shortages in big countries like Japan and South Korea.”
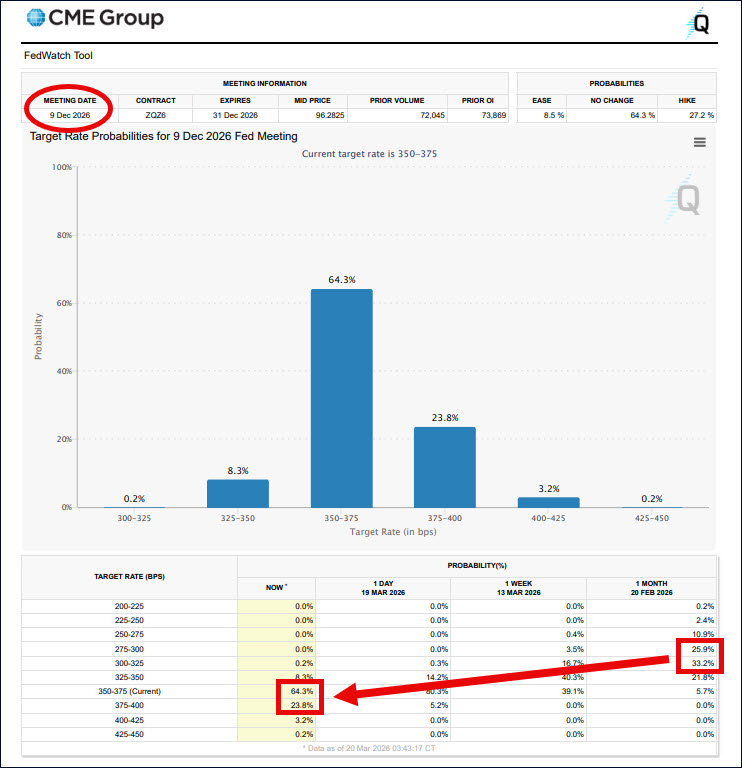
CME FedWatch tool, showing diminished odds of rate cuts by December.
Oil’s rally has already pushed gasoline to its highest price in almost four years, with two important results:
Even before the war, prices were rising. February’s producer price index (PPI) was about twice the forecast amount. Fed officials also increased their average inflation forecast and left interest rates unchanged in a meeting last Wednesday.
| Super Micro Computer (SMCI) | -33% |
| Mosaic (MOS) | -20% |
| Newmont (NEM) | -13% |
| Trade Desk (TTD) | -12% |
| Public Storage (PSA) | -11% |
| Source: TradeStation data |
Last week featured two important technology events. First, CEO Jensen Huang said Nvidia’s (NVDA) Blackwell and Vera Rubin AI chips have $1 trillion in orders through next year. He also discussed products from the company’s partnership with Groq and the NemoClaw developer toolkit.
Second, Micron Technology (MU) reported a very strong quarter, with earnings, revenue and guidance far above estimates. The memory-chip maker is building new factories to keep up with surging demand from AI datacenters.
While the news was positive, NVDA and MU ended the week lower. Are investors shifting focus away from AI and technology as geopolitical and economic risks increase?
Other major growth stocks fell. Tesla (TSLA) had its biggest weekly drop of the year and closed under its 200-day moving average for the first time since August. The slide came after UBS lowered its estimate for first-quarter deliveries. The bank also downplayed the potential for a positive reaction to Robotaxis and Optimus robots.
Meta Platforms (META) slid to its lowest level since November 21 amid reports its latest AI model was delayed. Eli Lilly (LLY) fell 8 percent, its biggest drop since August, following a downgrade by HSBC.
All told, the 12 largest members of the S&P 500 fell last week. All 12 have potentially bearish short-term trends (8-day exponential moving averages below their 21-day EMAs), according to TradeStation data.
Precious metals led the selling as investors took profits and braced for higher interest rates. Gold had its biggest weekly drop since 1983.
Chinese stocks, homebuilders and utilities also fell sharply. Those moves are consistent with higher interest rates. Energy stocks were the only noteworthy gainers.
| Ciena (CIEN) | +14% |
| Lumentum (LITE) | +13% |
| APA (APA) | +13% |
| Baker Hughes (BKR) | +11% |
| Halliburton (HAL) | +8.4% |
| Source: TradeStation data |
Super Micro Computer (SMCI) sank to a new 52-week low as the government indicted key individuals for allegedly smuggling AI chips into China.
Bank of America downgraded Mosaic (MOS) based on higher input costs resulting from the war. Ironically, the same company rallied the previous week after the war boosted fertilizer prices.
Newmont (NEM) fell along with gold miners. Trade Desk (TTD) dropped after key customer Publicis Groupe said it will stop recommending its ad-buying software.
Ciena (CIEN) led the gainers, continuing to rebound from a drop earlier in the month. APA (APA), Baker Hughes (BKR) and Halliburton benefited from the bounce in energy stocks. Delta Air Lines (DAL) jumped on strong guidance.
Credit worries continue to build. Tony Yoseloff of hedge fund Davidson Kempner Capital Management warned that a “substantial portion” of the private-equity industry is distressed following a decade of debt-financed acquisitions (according to FT). Morgan Stanley said AI will “drive defaults higher” for software companies with private loans (according to CNBC).
Reuters also reported that Blackstone’s (BX) flagship credit fund BCRED reported its first monthly loss since September 2022.
The S&P 500 has dropped for four straight weeks, its longest losing streak since March 2025. It also hit a six-month low on Friday, and Wilder’s Relative Strength Index (RSI) touched an oversold reading for the first time since April.
Such patterns may confirm the index’s trend has turned more bearish over the intermediate-term.
Prices fluctuated 4.3 percent from the week’s low to high. It was the biggest range since the week of April 28-May 2, which highlights increased volatility.
The S&P 500 is down 5.4 percent so far in March, and is on pace for the biggest monthly drop since the tariff selloff a year ago.
Traders may focus on at least two other price charts. First, the Nasdaq-100 has broken the bottom of a descending triangle. That may create risk of increased selling. The index’s 2 percent drop was also its sharpest decline since November.
Second, the 10-year U.S. Treasury yield rose for the third straight week to 4.39 percent, its highest level since mid-July. It’s up 43 basis points so far in March, the biggest monthly increase since October 2024. Could yields keep rising, given the inflationary pressure?
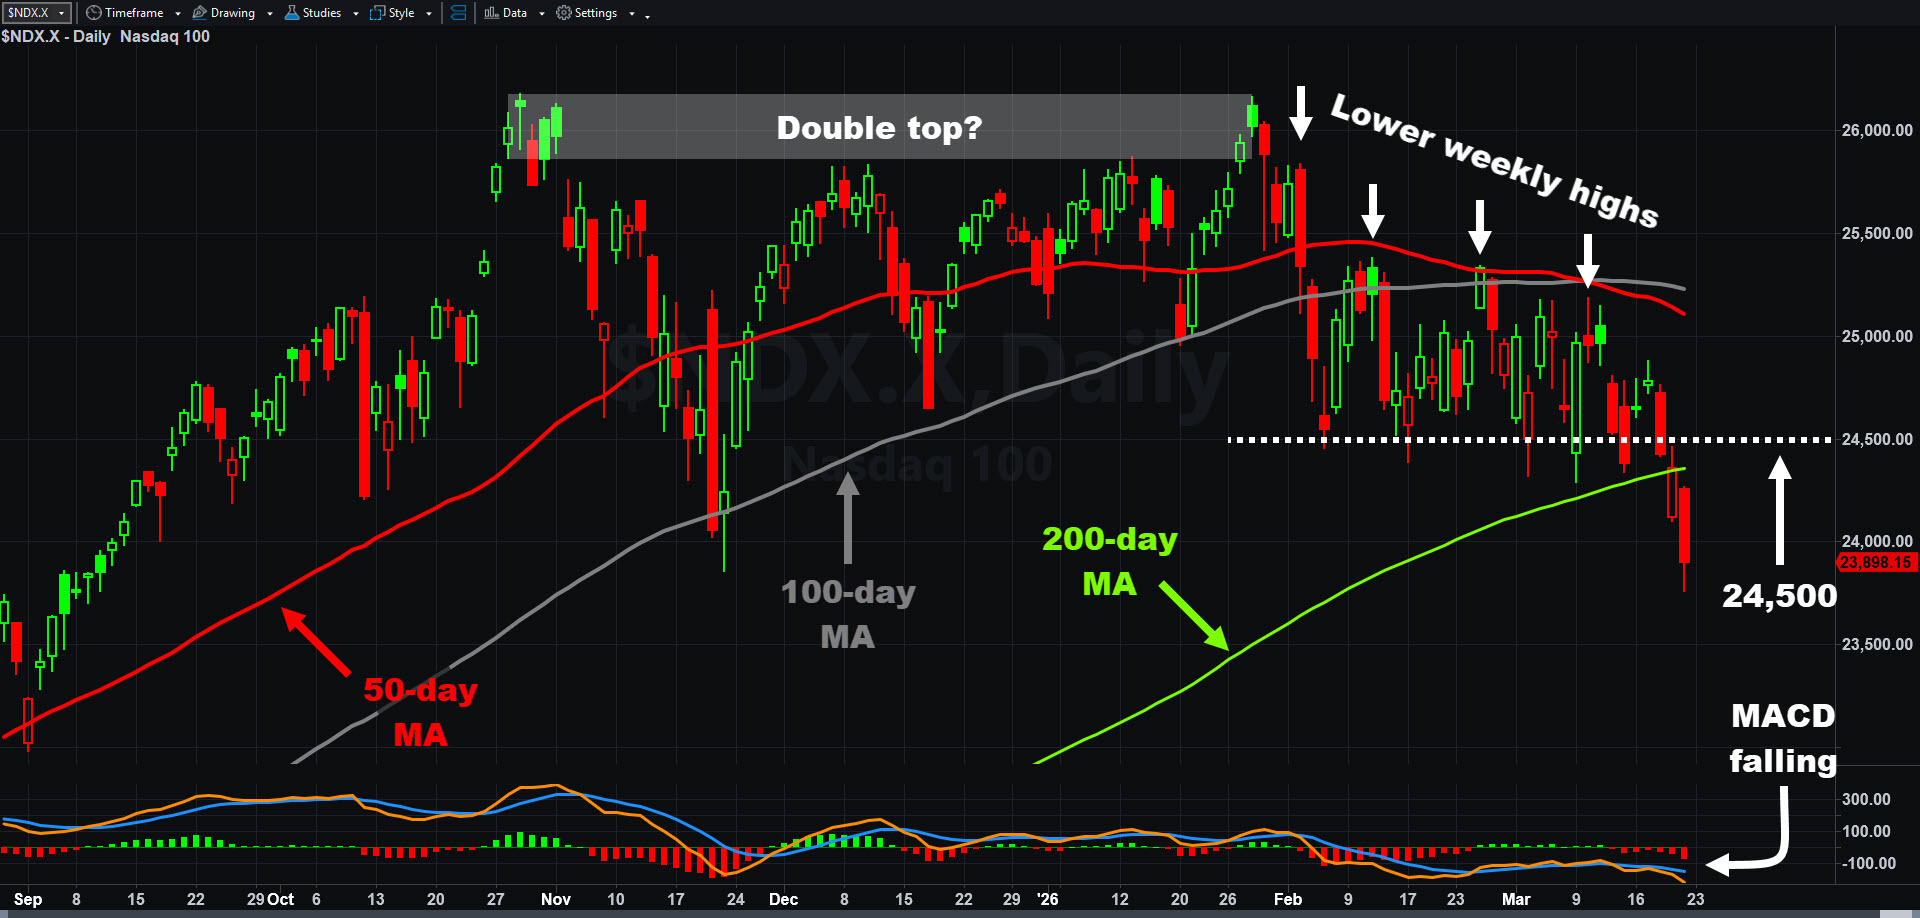
Nasdaq-100, daily chart, with select patterns and indicators.
The Iran war is likely to remain the dominant issue for markets in the near term, especially with Trump potentially signaling a desire to deescalate.
This week has few other important economic releases or earnings.
Crude oil inventories are on Wednesday morning.
Initial jobless claims are on Thursday morning.
Friday brings revised consumer sentiment, which may show changing views of the economy after the war began. Carnival (CCL) also issues quarterly results.
Futures trading is not suitable for all investors. To obtain a copy of the futures risk disclosure statement visit www.TradeStation.com/DisclosureFutures.

Volatility is rising as geopolitical and economic risks increase. How will natural born traders react?

Stocks have been crumbling as stagflation and war dominate sentiment.

Semiconductors have led stocks higher since the AI rally began, but they may face new risks as oil prices jump.