Can Semiconductor Stocks Withstand an Oil Shock?

AI Stock ‘Stays Cool’ as Iran War Rages
Vertiv has been a quiet beneficiary of the AI boom and now it’s getting noticed.
Call toll-free 800.328.1267

Semiconductors have led stocks higher since the AI rally began, but they may face new risks as oil prices jump.
The VanEck Semiconductor ETF (SMH) fell 6.4 percent last week, its biggest drop since the Liberation Day tariffs last spring. TradeStation data shows it lagging the broader SPDR Select Technology ETF (XLK) by the most since early 2022. Compared with the iShares Expanded Software ETF (IGV), chips had their worst week since at least 2001.
That extra weakness in chip stocks marks a dramatic reversal from January, when software makers were plunging. It may also highlight a risk to the AI boom, which relies on aggressive datacenter investment. Such capital spending is potentially sensitive to economic shocks like higher energy costs. That could be especially true when it’s financed by heavy borrowing.
The first issue might be higher interest rates. CME’s FedWatch tool on Friday showed a 46 percent chance the Federal Reserve will cut rates in June, down from 57 percent a week prior. (It came after the spike in oil prices pushed up inflation expectations.)
Second, there could be questions about global demand — especially from Middle Eastern countries like the United Arab Emirates and Saudi Arabia.
Third, the credit market is struggling after BlackRock (BLK) wrote down another loan and limited redemptions at one of its funds.
Next, cyclical assets fell sharply last week. Many were associated with datacenter investment, like HVAC companies, fiber optics and electronic manufacturing. (Semiconductors often move in tandem with such groups.) Other cyclicals like airlines, retailers and materials fell, potentially showing anxiety about the broader economy.
Finally, Broadcom (AVGO) was the last major chip stock to report this earnings season. While results beat estimates, investors may view them as backward-looking given the new circumstances since its last quarter ended.
CME’s crude oil futures (@CL) jumped 36 percent last week, the biggest gain since they first trading in 1983.
The spike came after violence in the Middle East halted traffic through the Strait of Hormuz. The weekend saw further strikes on Saudi oil fields, damage to a Kuwaiti refinery and at least two “force majeure” declarations. (That means oil producers say they cannot fulfill contractual promises to deliver product because of forces beyond their control.)
The conflict has also created significant uncertainty about tanker insurance. That could hurt a market already squeezed by recent attacks in the Red Sea.
Higher oil prices could have a greater impact on Europe and Asia because they import more energy than the U.S. (South Korea’s Kospi index, for example, had its biggest weekly drop since the pandemic.)
| Trade Desk (TTD) | +23% |
| Intuit (INTU) | +18% |
| LyondellBasell (LYB) | +17% |
| CF Industries (CF) | +16% |
| Expedia (EXPE) | +16% |
| Source: TradeStation data |
In addition to energy, the Middle East war is disrupting petrochemicals exports. That boosted LyondellBasell (LYB), a maker of plastic feedstock, and fertilizer maker CF Industries (CF).
Anxiety remained heightened Sunday night as @CL surged 25-30 percent to a new multiyear high.
Some of the other gainers last week were software companies like Trade Desk (TTD) and Intuit (INTU), which bounced from long-term lows. Expedia (EXPE) rose after OpenAI said ChatGPT won’t compete in the travel market.
Many other gainers last week were high-multiple growth stocks like AppLovin (APP) and Palantir Technologies (PLTR). That’s also consistent with a pivot away from cyclical companies.
Speaking of stocks that are sensitive to the economy and energy prices, Norwegian Cruise Line (NCLH) had its biggest weekly drop since the beginning of the pandemic. Carnival (CCL) also sold off.
IT hardware companies like Corning (GLW), SanDisk (SNDK) and Ciena (CIEN) also declined. Those companies had benefited from AI datacenter demand but now face potential economic worries.
| Norwegian Cruise Line (NCLH) | -19% |
| Carnival (CCL) | -18% |
| AES (AES) | -18% |
| Corning (GLW) | -18% |
| SanDisk (SNDK) | -17% |
| Source: TradeStation data |
Metals, airlines, homebuilders, small caps and emerging markets were some of the weakest groups overall.
Last week also brought potential evidence of stagflation in the U.S. economy.
Nonfarm payrolls shrank by 92,000 in February, missing estimates for growth of 60,000. Readings for the two previous months were revised down by a 69,000.
Earlier in the week, the Institute for Supply Management’s manufacturing index noted a spike in its price index. That has previously been associated with rising prices. European and Chinese inflation were both higher than expected.
That combination of weak employment and higher prices may reflect “stagnation.” It’s a toxic mix that forces central bankers to choose between fighting inflation — knowing it may increase job losses. Or they can protect jobs and let inflation run above target.
Still, other data was more positive last week. Jobless claims were below estimates and ADP’s private-sector payrolls report was strong.
Even before the current crisis, some chart watchers may have seen evidence of the broader market stalling.
For example the S&P 500 just made its lowest weekly high since the week before Christmas and the lowest weekly low since Thanksgiving week.
That created a potential topping pattern, with multiple failed attempts to cross 6,950.
Next, prices have stalled under the 21-day exponential moving average and the 50-day moving average. The 8-day EMA is also below the 21-day EMA. Those signals may reflect bearishness in the intermediate and short-term time frames.
Oscillators like Wilder’s relative strength index (RSI) and MACD have been trending downward as well. None have reached oversold conditions yet, which could make potential buyers reluctant to pull the trigger.
The index has also fallen below the 6,800 level has provided support all year.
Futures were down about 2 percent on Sunday evening, which could translate into a drop under the December 17 low of 6,720. Below that level, traders may eye the 200-day moving average or the November low of 6,534.
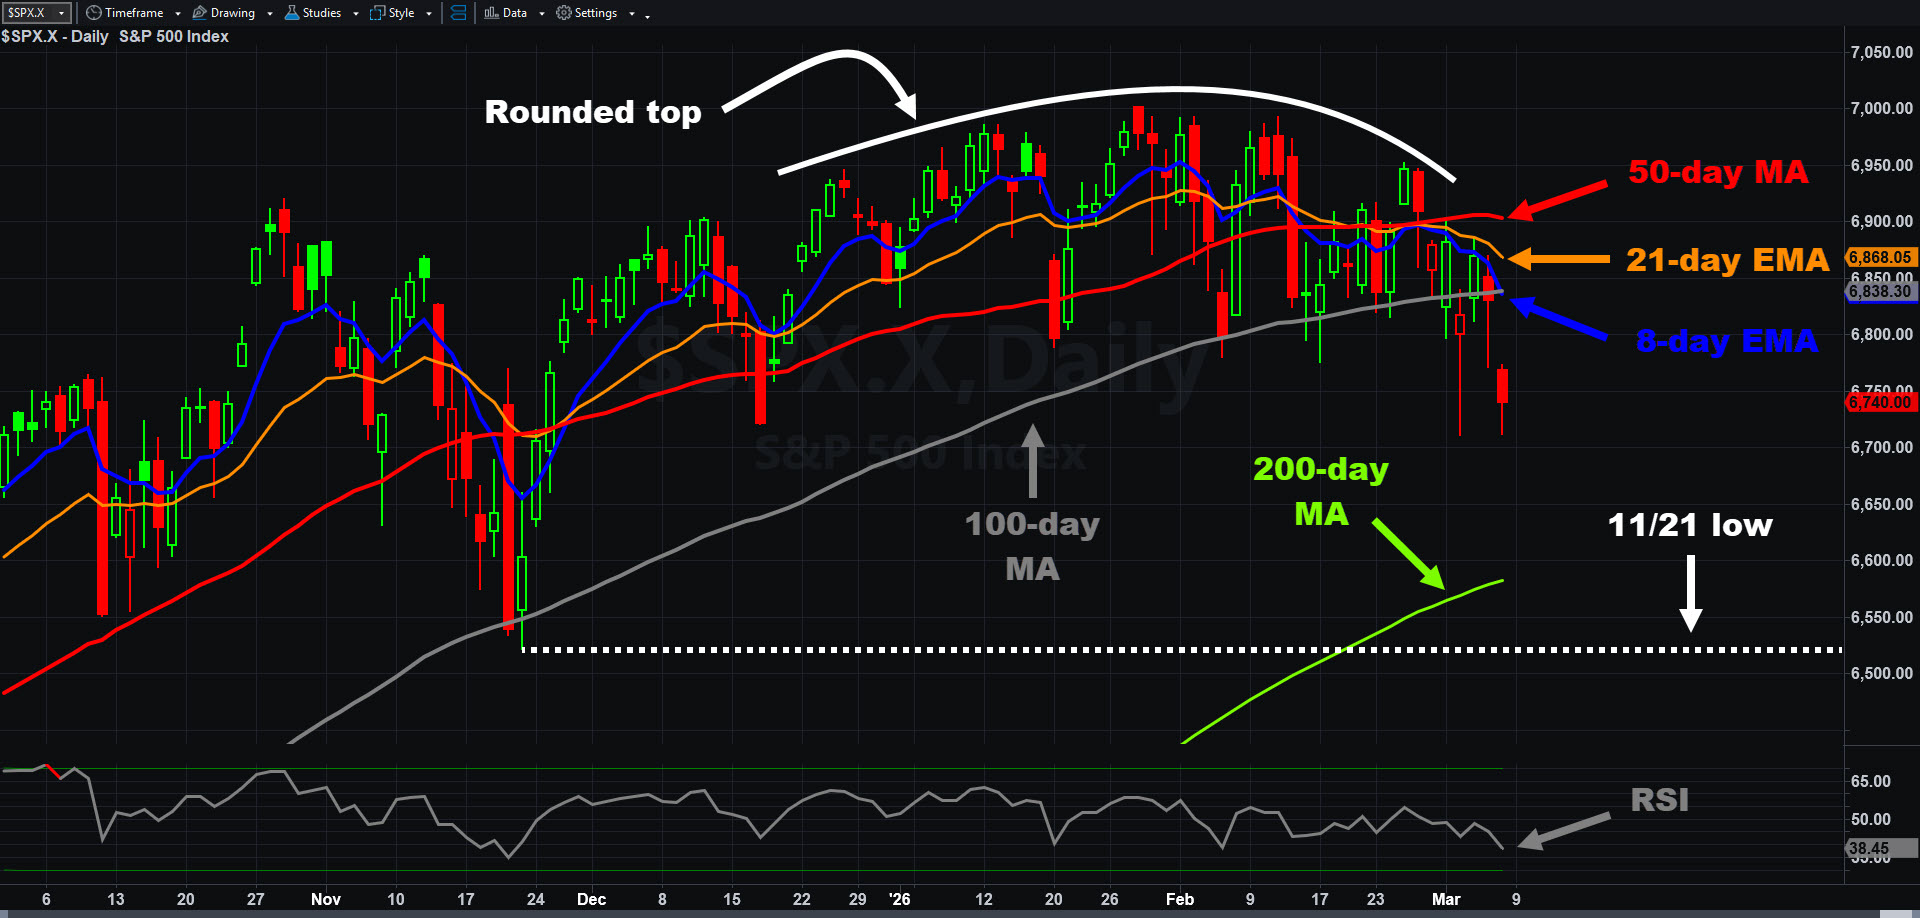
S&P 500, daily chart, with select patterns and indicators.
Geopolitical news and oil-market moves are likely to dominate sentiment this week. A few important economic reports are also due.
Hewlett-Packard Enterprise (HPE) reports earnings this afternoon.
Tomorrow brings existing home sales and earnings from Oracle (ORCL).
The February consumer price index (CPI) is on Wednesday morning, along with crude-oil inventories.
Thursday features initial jobless claims, housing start and building permits. Adobe (ADBE) and Lennar (LEN) issue quarterly results.
The revised reading of fourth-quarter economic growth is on Friday morning, along with January’s personal consumption expenditures (PCE) price index. Personal income and spending are also due.
Such reports would matter under normal circumstances. However they were delayed by the government shutdown and cover a period before the oil shock, which may limit their impact.
| ETF | 1 Year | 5 Years | 10 Years |
| VanEck Semiconductor ETF (SMH) | +74.58% | +237.29% | +1,511.30% |
| SPDR Select Technology ETF (XLK) | +23.05% | +112.33% | +577.21% |
| iShares Expanded Software ETF (IGV) | -16.31% | +15.02% | +338.78% |
| As of February 27, 2026. Based on TradeStation data. |
Exchange Traded Funds (“ETFs”) are subject to management fees and other expenses. Before making investment decisions, investors should carefully read information found in the prospectus or summary prospectus, if available, including investment objectives, risks, charges, and expenses. Click here to find the prospectus.
Performance data shown reflects past performance and is no guarantee of future performance. The information provided is not meant to predict or project the performance of a specific investment or investment strategy and current performance may be lower or higher than the performance data shown. Accordingly, this information should not be relied upon when making an investment decision.

Vertiv has been a quiet beneficiary of the AI boom and now it’s getting noticed.

Stocks are whipsawing after the White House suggested it may de-escalate the Iran war.

Volatility is rising as geopolitical and economic risks increase. How will natural born traders react?