Chart of the Day: Is Exxon Going Mobil?

AI Stock ‘Stays Cool’ as Iran War Rages
Vertiv has been a quiet beneficiary of the AI boom and now it’s getting noticed.
Call toll-free 800.328.1267

Exxon Mobil has been grinding higher since the summer, and now some traders may expect the move to accelerate.
The first pattern on today’s chart is the 2024 high of $126.34. The energy giant crossed that level yesterday and closed slightly above it, which could suggest a breakout is taking place.
Second, the 50-day moving average …
For more, please click here to view the related idea and chart analysis on TradingView.
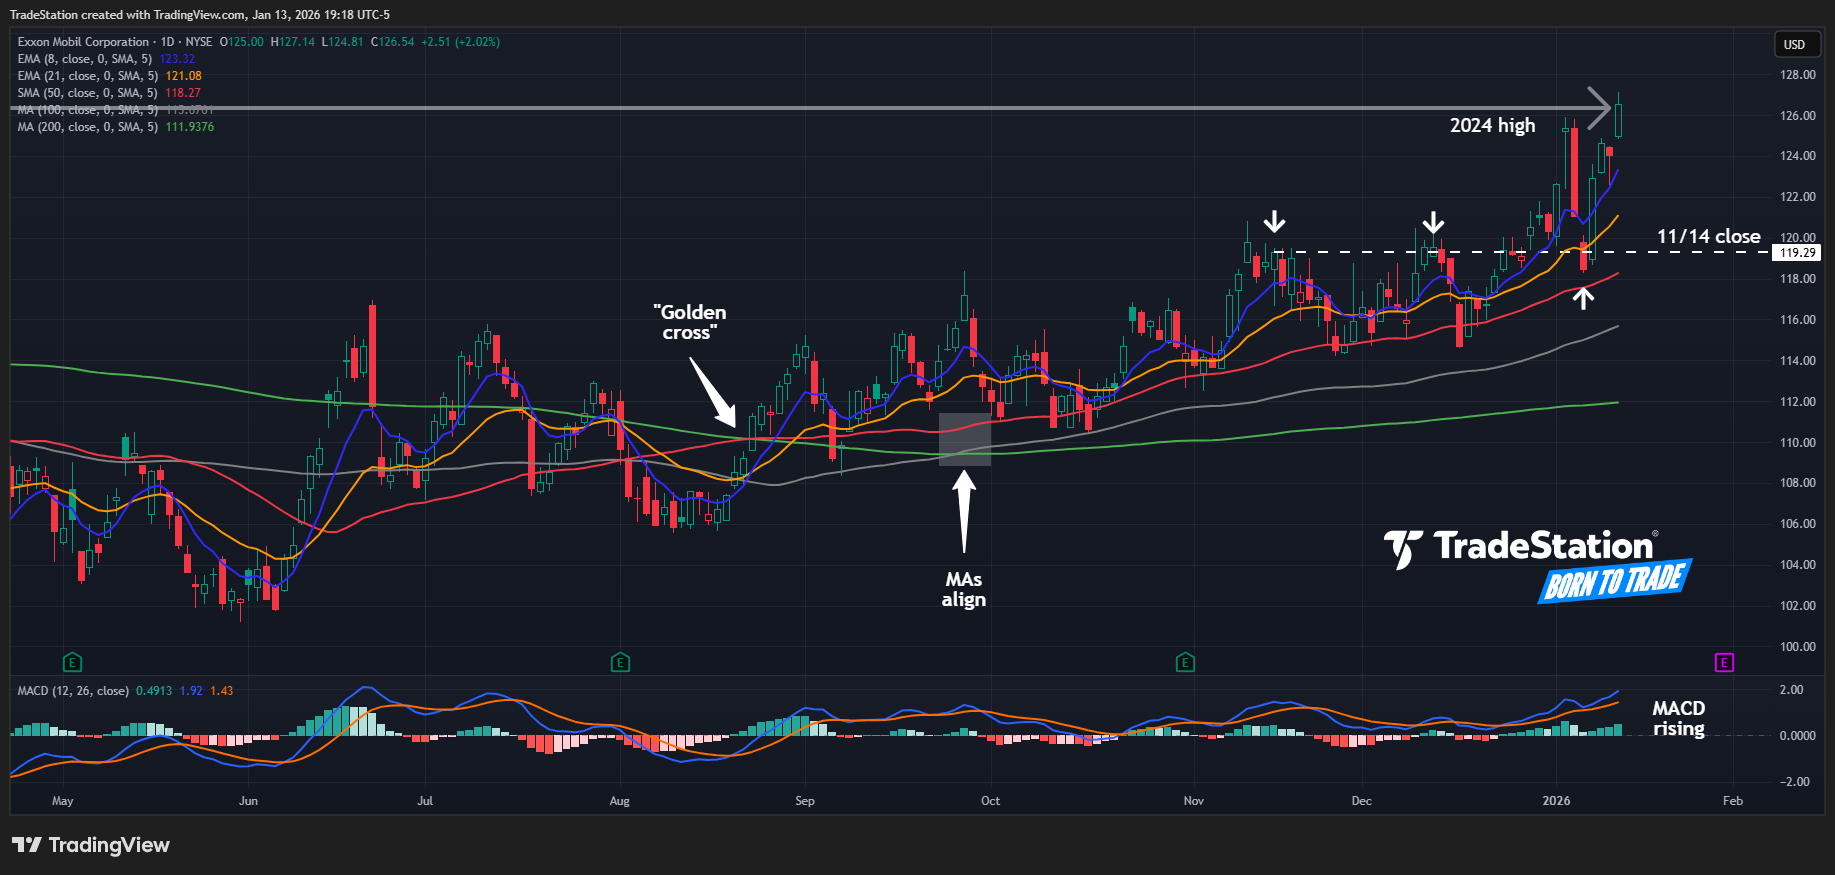
Exxon Mobil (XOM) daily chart, with select patterns and indicators, courtesy of TradingView.

Vertiv has been a quiet beneficiary of the AI boom and now it’s getting noticed.

Stocks are whipsawing after the White House suggested it may de-escalate the Iran war.

Volatility is rising as geopolitical and economic risks increase. How will natural born traders react?