The Federal Reserve lowered interest rates last week, while signaling it might not cut again soon. How have markets reacted to the news?
This article compares two strategies designed to capture a positive response to Wednesday’s move. One uses options on the heavily traded SPDR S&P 500 ETF (SPY). The other employs CME gold futures, which track the price of the precious metal.
Lower interest rates can lift both products because they support economic activity and risk-taking. SPY follows the broader S&P 500 index, which has exposure to other risks (like corporate earnings). Gold, on the other hand, can benefit from lower rates pushing down the value of the dollar.
SPY Debit Spread
Debit spreads are one of the most common option strategies. They involve:
- Buying a call or put near the money, which captures a directional move (calls can profit from rising prices, while puts can profit when prices fall).
- Selling a call or put further from the money, which offsets part of the cost of the position.
- The lower net cost can produce a higher percentage gain (leverage) from modest price moves.
- Debit spreads primarily profit from directional price movement, rather than time decay or changes in implied volatility.
- They are also called “vertical” spreads because they use different strike prices with the same expiration.
See this article for more on calls and puts. See this article for more on debit spreads.
SPY traded around $683 last Thursday, following the Fed’s announcement. A trader might have targeted the December expiration, with contracts expiring this Friday, December 19.
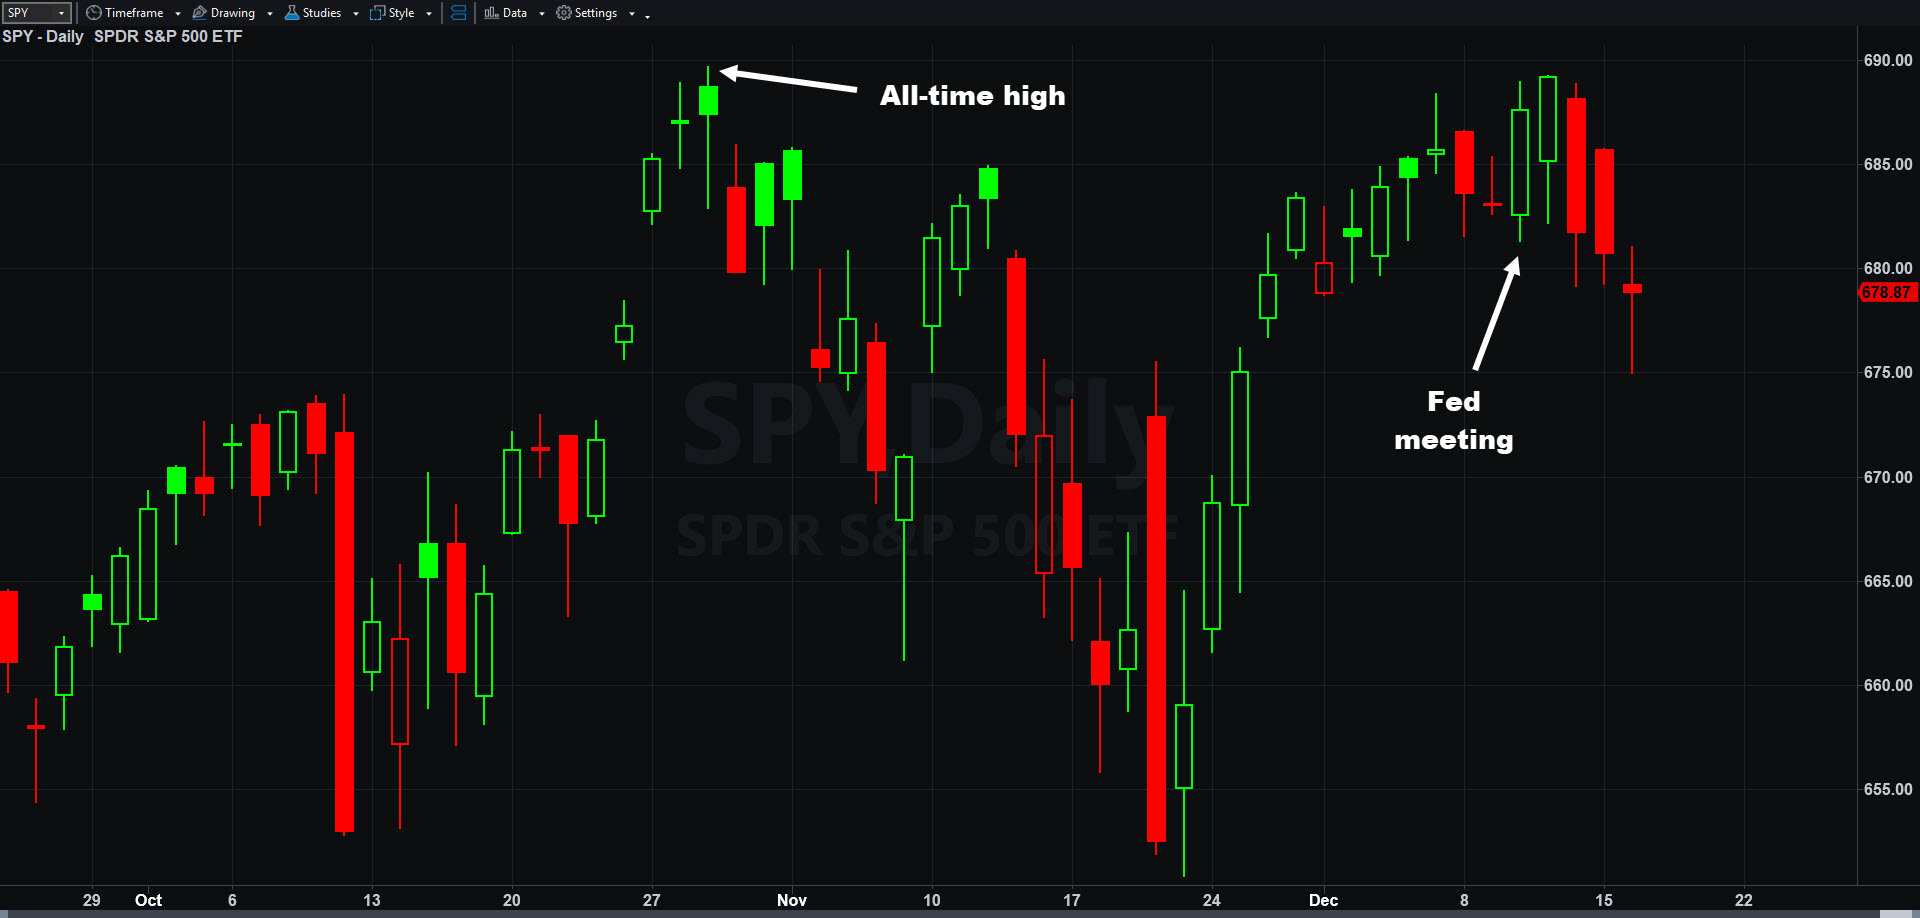
SPDR S&P 500 ETF (SPY), daily chart, showing key events.
He or she could have purchased the 685 calls for about $5 and sold the 690 calls for $3. That would translate into a cost of $2. The position could widen to $5 if SPY ends this week at $690 or higher. (That’s a potential gain of 150 percent from the underlier moving about 1 percent.)
The trade would have been profitable for a short time because the index rallied on December 11. However, SPY failed to hold its gains and the position was worth about $0.60 yesterday. While unprofitable, the strategy risked only limited capital. This is why traders often use debit spreads to manage volatile markets.
Gold Futures
Gold futures track the price of bullion. Long positions are taken to profit from the price moving up. Short positions can make money when the yellow metal falls. Futures trade virtually around the clock, letting customers trade outside of normal U.S. hours. (Unlike the SPY spread cited above, which can only be transacted between 9:30 a.m. ET and 4 p.m. ET.)
CME’s gold futures track 100 ounces of gold. That means they gain $100 for every $1 the metal rises. They lose $100 for every $1 the metal falls.
The root symbol is GC. Futures also have expiration months (expressed with a unique letter) and years. The current contract expires in February of 2026.
“G” is the identifier for February, so its symbol is GCG26.
GCG26 traded for about 4,340 last Thursday after the Fed meeting. It’s rallied about 90 since, translating into an increase of approximately $9,000. (See our margin requirements page for more.)
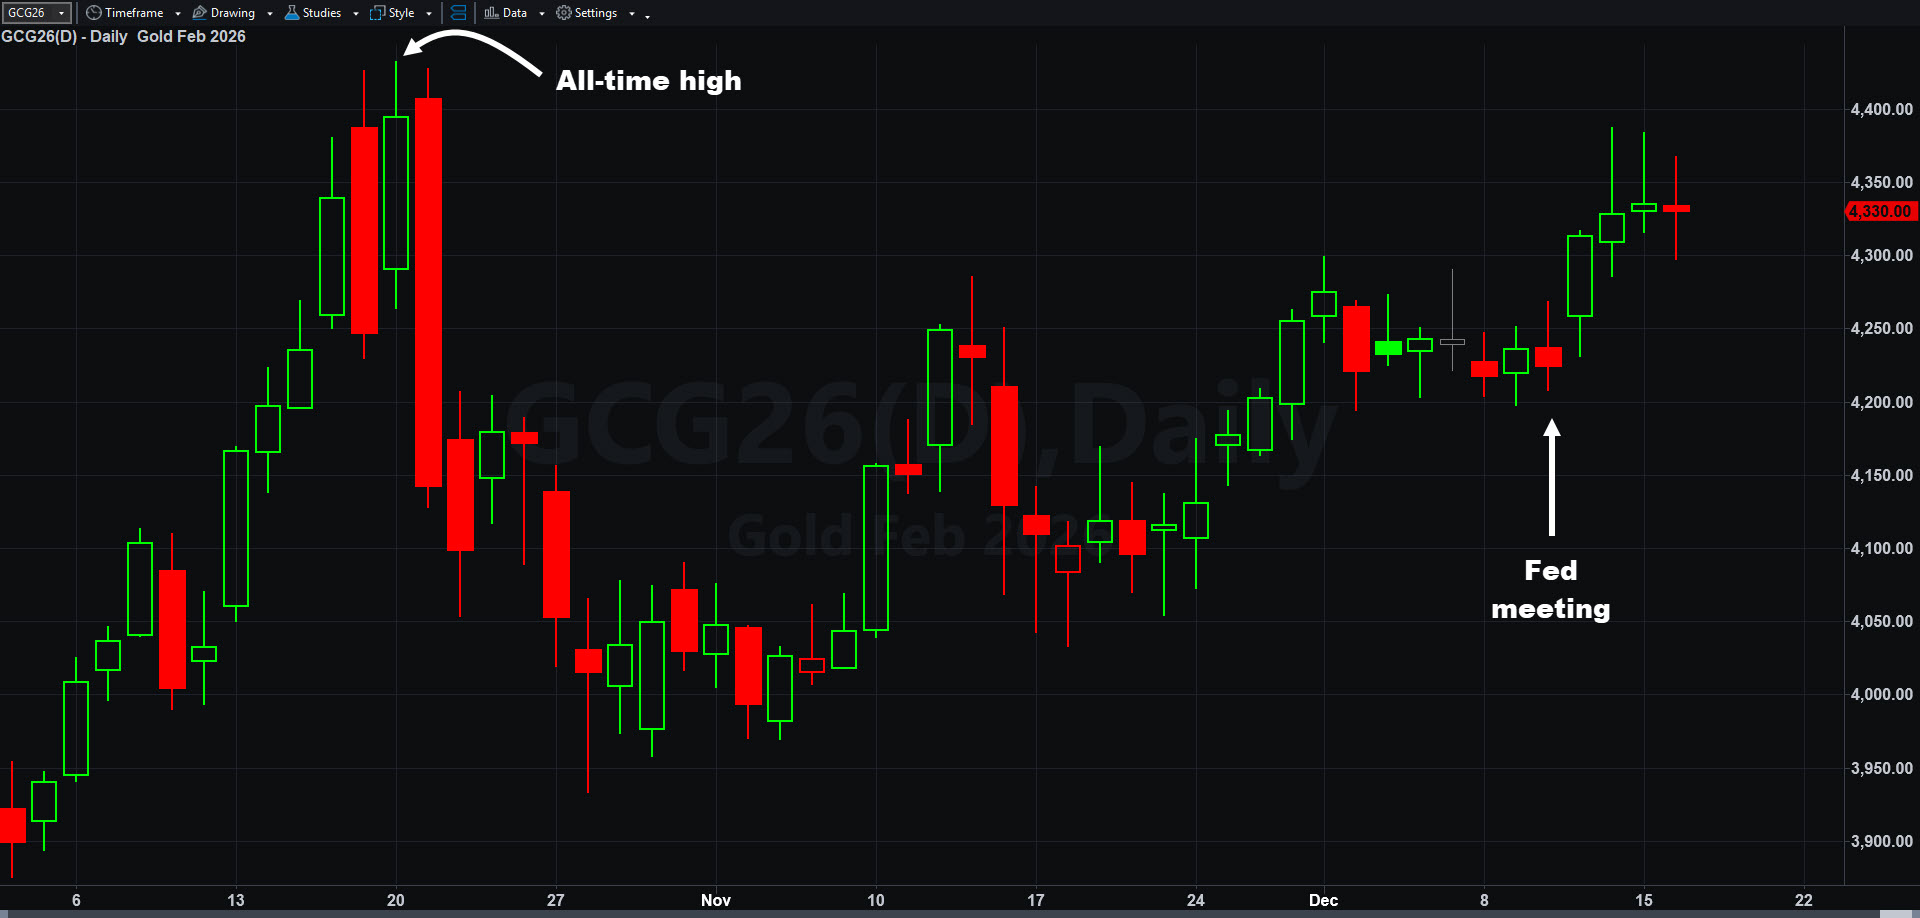
Gold futures (GCG26), daily chart, showing key events.
Options vs. Futures
Events like Federal Reserve decisions can create opportunities across multiple markets, but different instruments respond in different ways. Options on highly liquid ETFs such as SPY offer defined risk and relatively simple position sizing. However, they require the underlying asset to move in the expected direction within a specific time frame and trade only during U.S. market hours.
Futures, by contrast, provide more direct exposure to price movements and trade nearly around the clock, allowing traders to react to developments outside regular equity sessions. That flexibility can improve risk management, but it comes with greater risk — including the potential for losses beyond the initial margin.
Understanding these trade-offs can help traders choose the tool that best fits their market view, time horizon, and risk tolerance when reacting to major events like Fed meetings.
Standardized Performance of the ETF mentioned above
| ETF |
1 Year |
5 Years |
10 Years |
| SPDR S&P 500 ETF (SPY) |
+13.42% |
+88.75% |
+227.47% |
| As of November 28, 2025. Based on TradeStation data. |
|
|
|
Exchange Traded Funds (“ETFs”) are subject to management fees and other expenses. Before making investment decisions, investors should carefully read information found in the prospectus or summary prospectus, if available, including investment objectives, risks, charges, and expenses. Click here to find the prospectus.
Performance data shown reflects past performance and is no guarantee of future performance. The information provided is not meant to predict or project the performance of a specific investment or investment strategy and current performance may be lower or higher than the performance data shown. Accordingly, this information should not be relied upon when making an investment decision.
Futures trading is not suitable for all investors. To obtain a copy of the futures risk disclosure statement visit www.TradeStation.com/DisclosureFutures.
Options trading is not suitable for all investors. Your TradeStation Securities’ account application to trade options will be considered and approved or disapproved based on all relevant factors, including your trading experience. See www.TradeStation.com/DisclosureOptions. Visit www.TradeStation.com/Pricing for full details on the costs and fees associated with options.
Margin trading involves risks, and it is important that you fully understand those risks before trading on margin. The Margin Disclosure Statement outlines many of those risks, including that you can lose more funds than you deposit in your margin account; your brokerage firm can force the sale of securities in your account; your brokerage firm can sell your securities without contacting you; and you are not entitled to an extension of time on a margin call. Review the Margin Disclosure Statement at www.TradeStation.com/DisclosureMargin.