Chart of the Day: Has Coca-Cola Lost its Pop?

Nasdaq Keeps Running as Bulls Move to Software
The Nasdaq-100 keeps running as the AI boom widens across the technology sector.
Call toll-free 800.328.1267

Coca-Cola has gone nowhere for a year, and some traders may see downside risk.
The first pattern on today’s chart is the series of lower highs since April — despite an uptrend in the broader market at the same time. Does that relative weakness indicate a lack of buying interest?
Second, the soft-drink maker ended Friday at …
For more, please click here to view the related idea and chart analysis on TradingView.
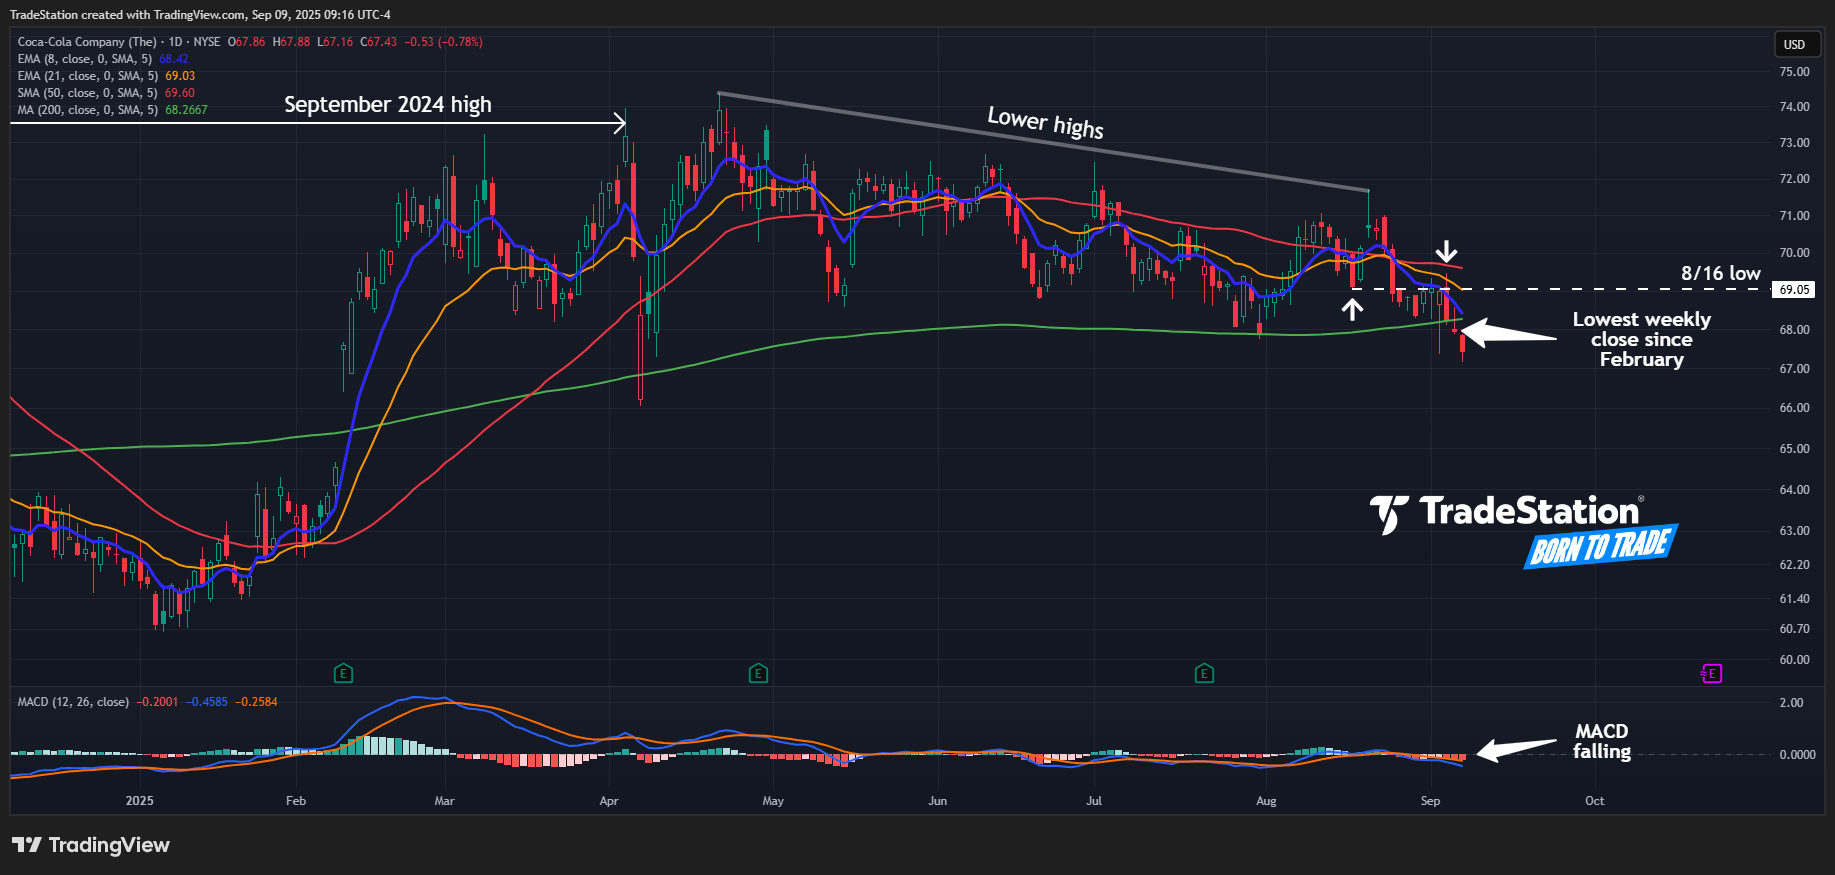
Coca-Cola (KO) daily chart, with selected patterns and indicators, courtesy of TradingView.

The Nasdaq-100 keeps running as the AI boom widens across the technology sector.

Apple has been snoozing for months, but there could be signs of a breakout

Growth stocks could be staging a comeback as May begins. Learn more about AI’s broadening effect and the growth in Apple.