Money Shifts from Megacaps as Powell Turns Dovish

AI Stock ‘Stays Cool’ as Iran War Rages
Vertiv has been a quiet beneficiary of the AI boom and now it’s getting noticed.
Call toll-free 800.328.1267

Investors are pivoting away from megacaps, positioning for the Federal Reserve to cut interest rates.
The S&P 500 just finished a strange move. The index declined for six straight sessions between Thursday, August 14, and Thursday, August 21, its longest losing streak of the year. It then erased all those losses in a single big rally on Friday, ending last week up 0.3 percent.
Fed Chairman Jerome Powell triggered the move with comments in Jackson Hole, Wyoming.
“Downside risks to employment are rising,” he said at the annual symposium. “With policy in restrictive territory … the shifting balance of risks may warrant adjusting our policy stance,” toward lower interest rates.
Reassured the central bank is more willing to support the economy, investors scrambled into stocks that could benefit. Many of them underperformed in the last year, resulting in a small value rotation:
| Dayforce (DAY) | +31% |
| Paramount Skydance (PSKY) | +17% |
| EPAM Systems (EPAM) | +11% |
| LyondellBasell Industries (LYB) | +10% |
| Packaging Corp. of America (PKG) | +10% |
| Source: TradeStation data |
All told, 82 percent of the S&P 500’s members rose last week. That’s a surprisingly large proportion given the index’s gain of just 0.3 percent.
The reason is that megacap growth stocks struggled. TradeStation data showed that, of the nine companies worth at least $1 trillion, only three rose last week: Tesla (TSLA), Berkshire Hathaway (BRK.B) and Alphabet (GOOGL).
Other major AI names fell, including Broadcom (AVGO), Microsoft (MSFT) and Nvidia (NVDA). Palantir Technologies (PLTR), a smaller company closely associated with AI, had its biggest weekly drop since early April.
OpenAI CEO Sam Altman may have prompted some of the selling by suggesting AI stocks were in a bubble. Advanced Micro Devices (AMD), Dell Technologies (DELL) and Oracle (ORCL) declined as well.
The selling made technology the only sector to fall more than 1 percent last week. The Nasdaq-100 was also the only major index to close in the red.
The Dow Jones Industrial Average, on the other hand, was the only major index to close at a new all-time high. That weakness in the Nasdaq and strength in the Dow additionally highlight last week’s shift from growth stocks to value stocks.
Powell’s dovish messaging also caused the U.S. dollar to lose value for the third straight week. That supported precious-metal plays like gold and silver miners, along with global stocks. China and Mexico were especially strong.
| Palantir Technologies (PLTR) | -10% |
| Intuit (INTU) | -7.5% |
| Advanced Micro Devices (AMD) | -5.5% |
| Dell Technologies (DELL) | -5.4% |
| Oracle (ORCL) | -4.8% |
| Source: TradeStation data |
Dayforce (DAY) was the biggest gainer in the S&P 500 last week after accepting a $12 billion takeover by Thoma Bravo. Paramount Skydance (PSKY) surged on optimism about profit-boosting job cuts after its recent merger.
Analog Devices (ADI) didn’t make the top five, but it climbed 8.9 percent on strong quarterly results.
Intuit (INTU), on the other hand, fell after beating estimates. A bigger issue could be that investors seem to be selling high-multiple software companies. (See this recent article for more.)
The S&P 500 remains in an uptrend, with few apparently negative signals.
Friday’s 1.5 percent rally was the biggest one-day gain since May 27. The bounce occurred at both the 21-day exponential moving average and a 50 percent retracement of the move between August 1 and August 15. Those signals potentially confirm the bullish direction.
The Advance/Decline (A/D) line also made a new high, reflecting positive breadth.
Cboe’s Volatility Index (VIX) ended last week at its lowest level since early December. That may indicate limited selling pressures.
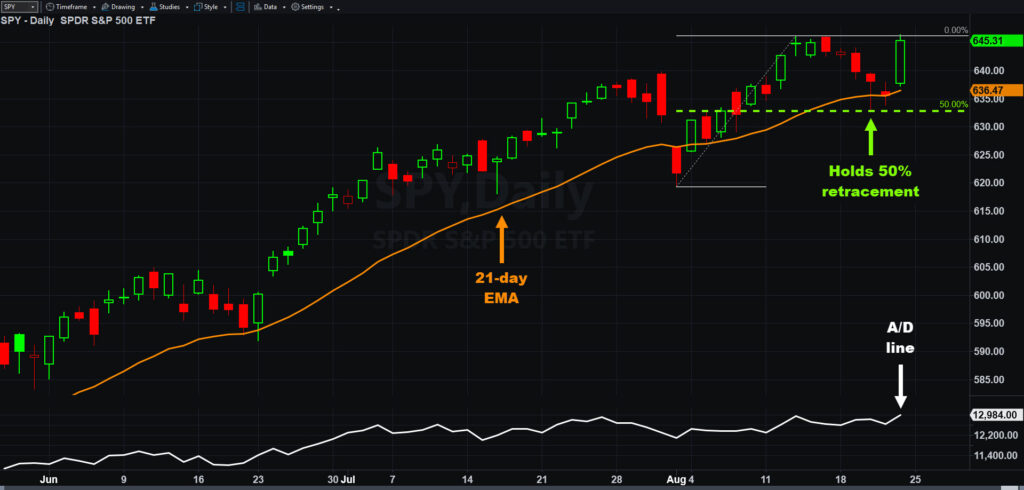
SPDR S&P 500 ETF (SPY), daily chart, with select patterns and indicators.
This week features earnings by the market’s biggest company, Nvidia (NVDA), and some noteworthy economic reports.
New home sales are due this morning.
Tomorrow brings durable-goods orders and consumer confidence. MongoDB (MDB) and Okta (OKTA) announce results in the afternoon.
Crude-oil inventories are on Wednesday morning. NVDA reports in the postmarket, along with CrowdStrike (CRWD), HP (HPQ) and Snowflake (SNOW).
Thursday features the first revision of last quarter’s gross domestic product (GDP), plus initial jobless claims. Best Buy (BBY), Dollar General (DG), DELL and Marvell Technology (MRVL) announce earnings.
The big item on Friday is the personal consumption expenditures (PCE) inflation report. Personal income and spending are also part of the report.
That’s followed by a three-day weekend because of Labor Day. Trading will resume on Tuesday, September 2.
| ETF | 1 Year | 5 Years | 10 Years |
| SPDR S&P 500 (SPY) | +14.75% | +93.58% | +200.28% |
| As of July 31, 2025. Based on TradeStation data | |||
Exchange Traded Funds (“ETFs”) are subject to management fees and other expenses. Before making investment decisions, investors should carefully read information found in the prospectus or summary prospectus, if available, including investment objectives, risks, charges, and expenses. Click here to find the prospectus.
Performance data shown reflects past performance and is no guarantee of future performance. The information provided is not meant to predict or project the performance of a specific investment or investment strategy and current performance may be lower or higher than the performance data shown. Accordingly, this information should not be relied upon when making an investment decision.

Vertiv has been a quiet beneficiary of the AI boom and now it’s getting noticed.

Stocks are whipsawing after the White House suggested it may de-escalate the Iran war.

Volatility is rising as geopolitical and economic risks increase. How will natural born traders react?