Using AI With Dynamic Market Data

This is the second in a series of articles on AI and investing. Here’s a link to our previous post.
Artificial intelligence is already changing the landscape of corporate America, boosting productivity and results at a growing number of companies. Today we’ll consider how it can potential boost your productivity and results as a trader. In particular, this article will explain how data from TradeStation can be systematically combined with AI.
We used the same three large language models: ChatGPT 4.0, Perplexity and Grok. They performed similarly answering the questions below. (Marked in blue text.)
Next, remember that AI has limits. Large language models (LLMs) mostly process textual data and can be influenced by old information they learned in their training. They aren’t designed to handle these kinds of jobs, which is why we carefully refined and tested prompts to generate relevant outcomes. Below are two kinds of questions for AI models: short-term and intermediate-term. We’ll use them to learn about stocks discovered by TradeStation’s powerful analytic tools.
Short-Term AI Prompt
Customers can discover moving stocks with TradeStation’s tools (explained below) and immediately research the tickers. Users can open a new AI session and use it exclusively for this work, keeping the model focused on a single kind of input and output. This prompt can be used for understanding short-term movers that are rising or falling today:
In this session I want to ask similar recurring questions and have you keep answering in a specific way. Maintain the format throughout, persistently answering each time when I give you a ticker and price direction. Research current news and social media to give concise information. Avoid using old facts from your training. Don’t show charts or recap price action and % changes. I have all of that. No filler info. Responses should be like this:
Me: ADI down
You: Semiconductors: Falling despite strong earnings
Do you understand?
The goal is to feed the model a series of tickers, each in its own query. (Multiple tickers at a time can reduce the thoroughness of search on each.) We’re now ready to quickly progress through a list of tickers. Generating such a list is the next task.
Finding Short-Term Movers
TradeStation offers several tools for discovering stocks on the move. The first is Hot Lists, which can be accessed from the Apps button at the top left of the desktop. Hot Lists has a series of dynamically updated searches for stocks displaying unusual fluctuations in price, volume or options activity. Most of the relevant searches will be found under the “Equities” group in the Asset field. In the Activity field, users can expand the “Price Lists” folder to find several relevant lists. Some of these include:
- % Gainers – 1 Day
- % Losers – 1 Day
- Approaching 52Wk High%
- Variants for different time frames, like 5 and 10 day, are available.
Next is RadarScreen®, which can perform calculations on a list of provided symbols. It can also be opened from the App button. Customers can next click on Data → Add Symbol List → S&P 500 to populate all the companies in the S&P 500 index. They can then sort by the column “Net %Chg” to find stocks that are up or down significantly in the session.
Both of these techniques will typically provide multiple stocks that are making sharp moves. These can be passed to the AI models using the method described above, letting customers consistently and systematically discover stocks. The reasons for their movement will be quickly understood, giving a starting point for further research and planning.
Intermediate-Term AI Prompt
The query above is intended for short-term movers that could be rising or falling in the last week. Other stocks may be appreciating (or declining) over longer time frames of months and quarters. These may offer opportunities for longer-term trend following. However, the reasons for their moves may lie further in the past and require different kinds of AI prompts.
In this session I want to ask similar recurring questions and have you keep answering in a specific way. Maintain the format I want, persistently answering the same way each time when I give you a ticker.
I will ask you about stocks that have been trending higher or lower in the last 12 months. I want concise answers that incorporate months of information, especially earnings reports. When relevant, cite margins, specific products, unit growth, transformation efforts and strategic initiatives like buybacks. Only rely on news encountered in this search and avoid using assumptions from your training
Also provide forward-looking insights on what the next likely catalyst will be: Are there earnings, drug trials or investor events?
I will provide a ticker and direction. You will answer with the company’s industry/sector and 2-3 sentences explaining the longer-term move. Do not give price action or charts because I have that information. This is how the responses should look:
Me: PLTR
You: Software: Powerful data intelligence. Gaining customers as it moves from government to enterprise space. Next event: earnings on Aug. 4.
No charts. No filler. No sprawling earnings and revenue numbers. I have all of that.
Don’t attribute moves to information from your training. Rely entirely on recent search results. Favor earnings and thematic financial and business trends cited by credible sources. Don’t include lots of dollar figures. Include next likely catalyst that could help traders plan for moves.
Do you understand?
This query tells the model to survey longer periods of time and to favor certain kinds of news. This helps it overlook irrelevant headlines and focus on the kinds of stories more likely to explain stock movement. It also reiterates key instructions like avoiding charts and knowledge from its training.
Finding Intermediate-Term Movers
Scanner can help us identify stocks for this kind of prompt. It can be access from the Apps button. Once it’s open, customers can follow these steps:
- Click “Create Scan” at the top left.
- Provide a name like “Intermediate term AI scan”
- Click Next for the Symbol Universe tab. In the “Symbols to Include” field, click the box for “All Stocks.”
- The next tab lets users set criteria for the scan. These choices can be programmed. All the values listed below can be adjusted.
- Capitalization → Market Capitalization (Mil) > 1000
- Find stocks with at least $1 billion of market cap.
- Capitalization → Market Capitalization (Mil) > 1000
- Find stocks averaging at least 500,000 shares of volume per session over the last 10 days.
- Find stocks that have gained at least 40 percent in the last year.
- Find stocks that have declined at least 5 percent in the last four weeks.
These criteria will find stocks that have appreciated significantly in the last year, but declined in the last four weeks. These pullbacks may present opportunities to enter before uptrends potentially continue. The AI prompt above will look far enough back in time to discover the reason for the longer-term move move.
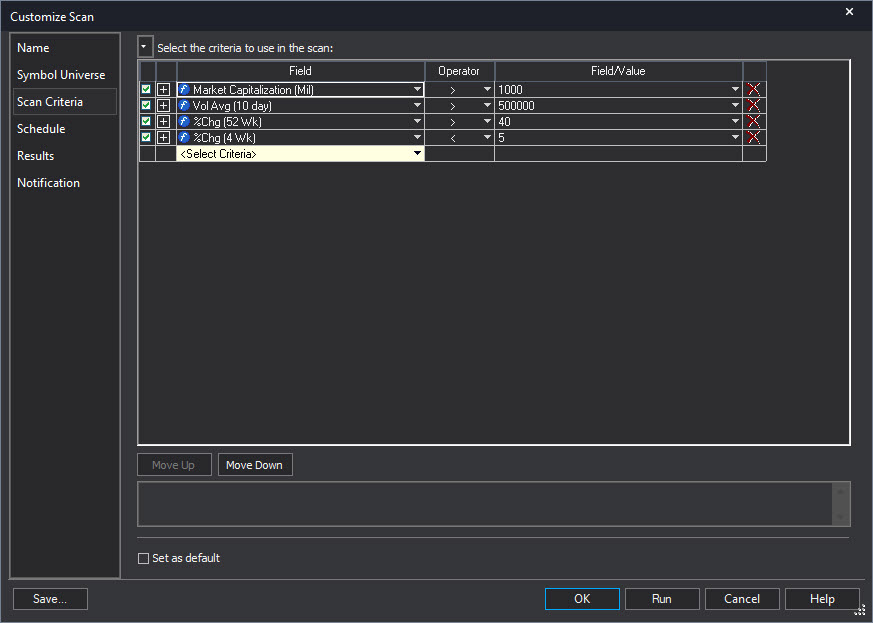
Scanner app, showing criteria listed above.
Data Powering AI
The steps listed use two different technologies, leveraging the strengths of each to help you understand market conditions.
We draw market data from TradeStation, which lets us perform powerful and customized searches. AI models, on the other hand, have spotty access to market data and cannot easily perform calculations for large numbers of stocks.
Second, we use the AI tools where they have a clear advantage: digesting and summarizing large amounts of text according to specific instructions.
As a result, we draw on the strengths. We also avoid a weakness of AI (confusion and hallucination) by focusing it with real data and strict prompts. Focusing on a single company at a time can additionally improve results.
In conclusion, AI was created to help with text generation — not financial analysis. However, it can be combined with older market-data technology to produce large amounts of useful and actionable insights. It’s another example of how new applications are constantly emerging in this fast-evolving field.
.jpg&w=3840&q=75)