Chart of the Day: Potential Uptrend in Newmont

Netflix Falters as AI Lifts Other Stocks
Netflix has struggled as AI trades dominate the market. Is the long-term growth stock finally stalling?
Call toll-free 800.328.1267

Newmont has been climbing this year, and some traders may see further upside in the S&P 500’s only pure-play gold miner.
The first pattern on today’s chart is the pullback since mid-April. The lower low, lower high and second lower low may be viewed as …
For more, please click here to view the related idea and chart analysis on TradingView.
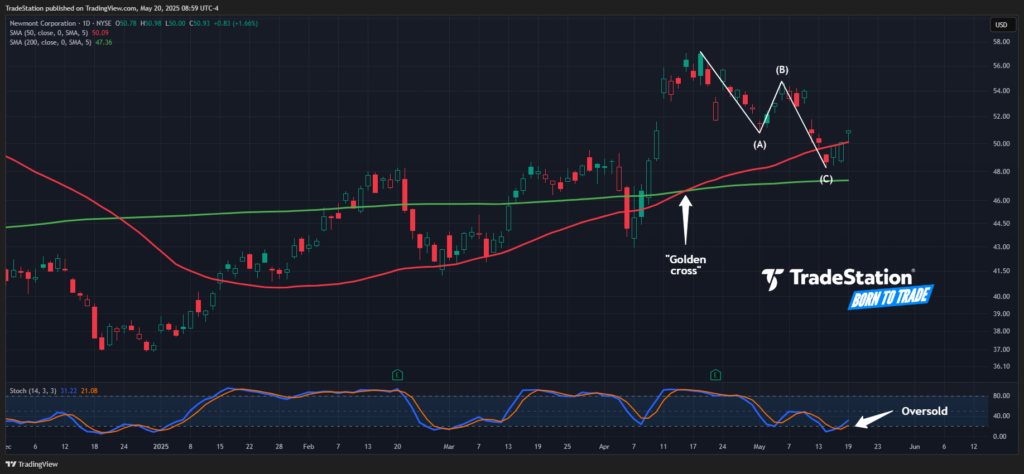
Newmont (NEM), daily chart, with selected patterns and indicators, courtesy of TradingView.

Netflix has struggled as AI trades dominate the market. Is the long-term growth stock finally stalling?

The Nasdaq-100 keeps running as the AI boom widens across the technology sector.

Apple has been snoozing for months, but there could be signs of a breakout