Chart of the Day: Is Goldman Going Higher?

Call Volume Spikes: Has Oracle Bottomed?
Is Oracle finally bottoming? Some traders may think it has.
Call toll-free 800.328.1267

Goldman Sachs has gone seven weeks without a new high, but some traders may see further upside in the Wall Street giant.
The first pattern on today’s chart is the series of lower highs between late September and late October. GS has spent more than two weeks above that falling trendline, which may confirm the slide has …
For more, please click here to view the related idea and chart analysis on TradingView.
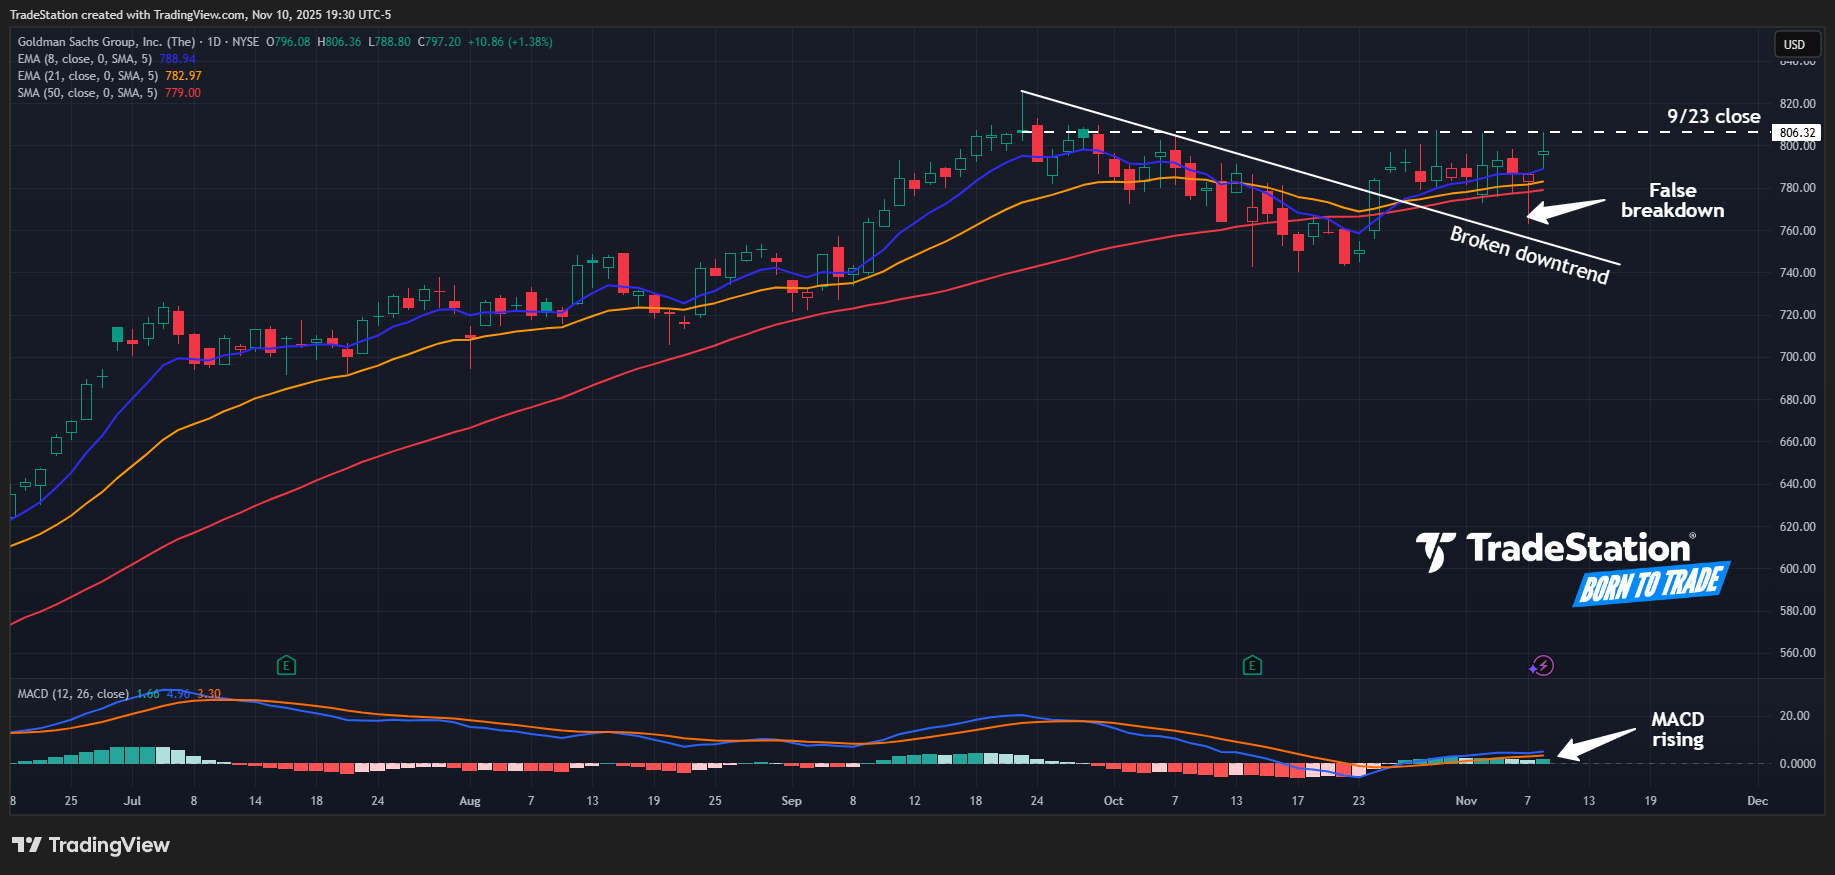
Goldman Sachs (GS), daily chart, with selected patterns and indicators, courtesy of TradingView.

Is Oracle finally bottoming? Some traders may think it has.

Nebius consolidated for months, but some traders may think the datacenter stock is breaking out. The first pattern on today’s chart is the long basing pattern between November and late March. (It could also be viewed as a cup and handle following the rally between...

Chipmakers are trying to break out as investors brace for a potential oil shock.