Using Fibonacci Retracements on TradeStation

Stock prices often zig and zag instead of moving in a straight line. Today we’ll explore Fibonacci retracements, a popular tool for navigating ups and downs in stock and futures markets.
The Fibonacci (“Fib”) tool is a drawing instrument on TradeStation’s charts that plot lines for potential pullbacks. It’s based on a series of numbers discovered by medieval mathematician Leonardo Fibonacci. While the calculations are complicated, their use in the market is relatively straightforward.
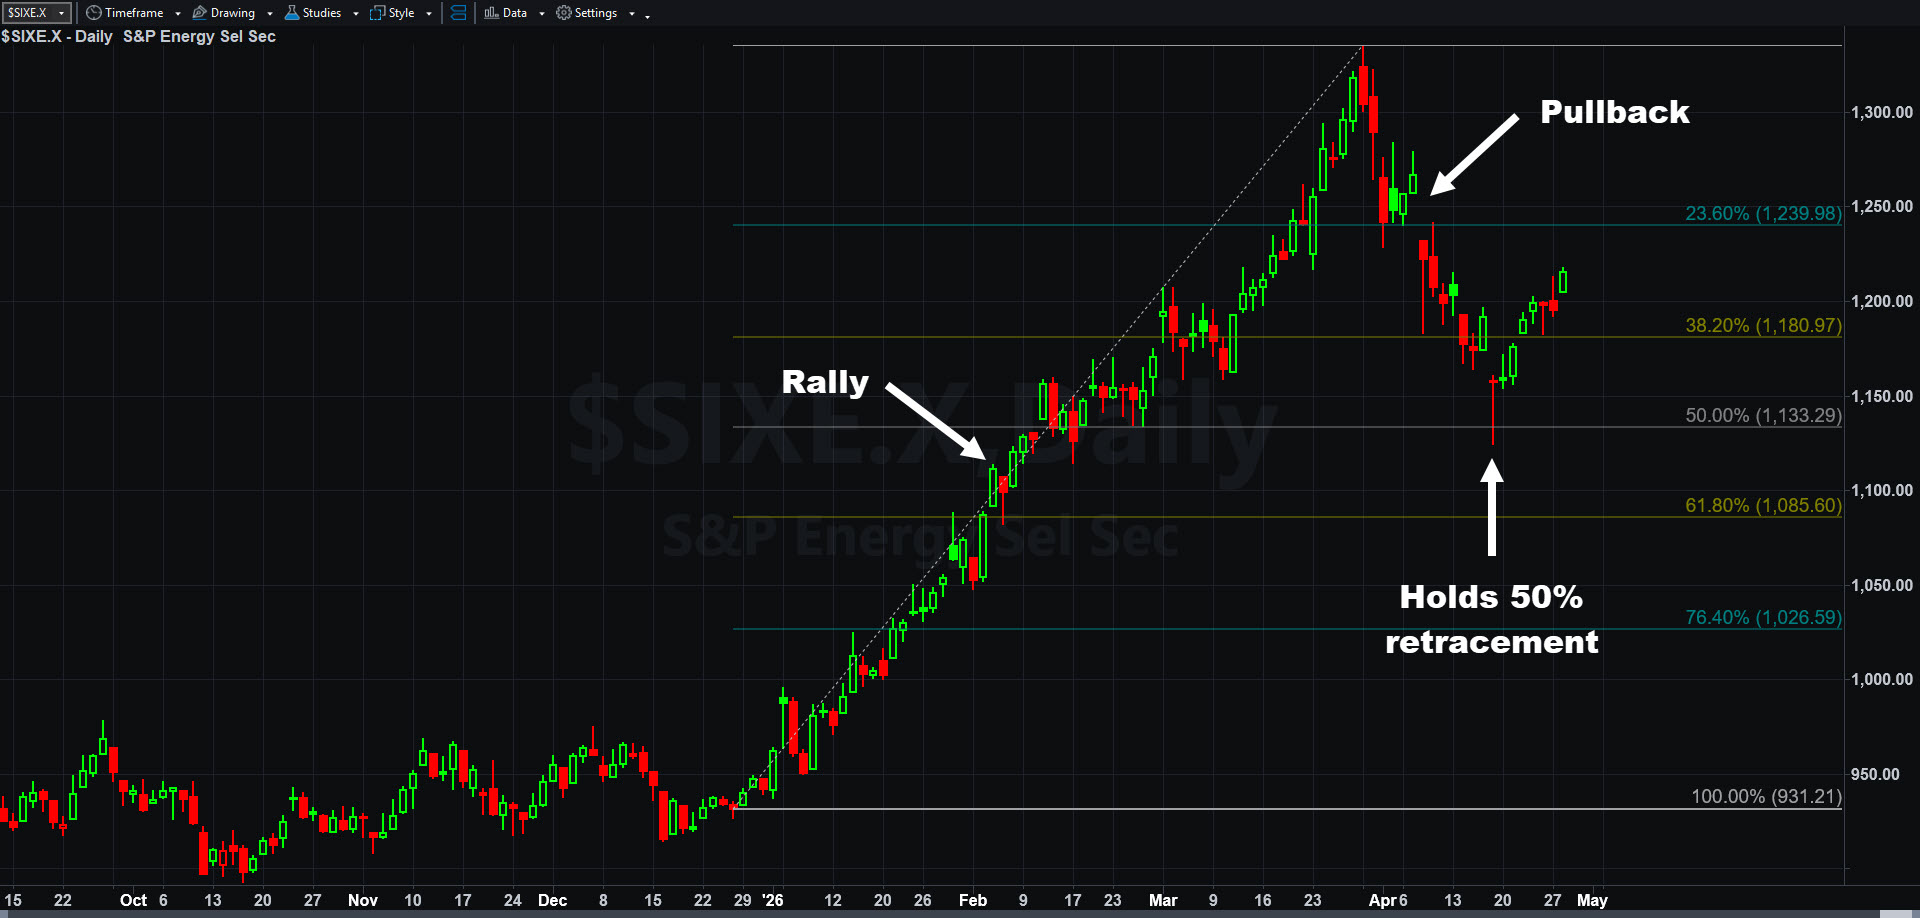
S&P Energy Select Index ($SIXE.X), daily chart, showing recent Fibonacci retracement.
Fibonacci Retracement Levels
Simply put, the Fibonacci trading looks for stocks to give back, or “retrace,” certain amounts of a move. They’re based on percentages of the advance or decline. The Fibonacci tool looks for retracements of:
- 23.6 percent
- 38.2 percent
- 50 percent
- 61.8 percent
- 76.4 percent
Bullish traders can use these countertrend moves to identify pullbacks in an upward-trending stock they’d like to buy. Bearish Fibonacci traders can look for potential rebounds to sell.
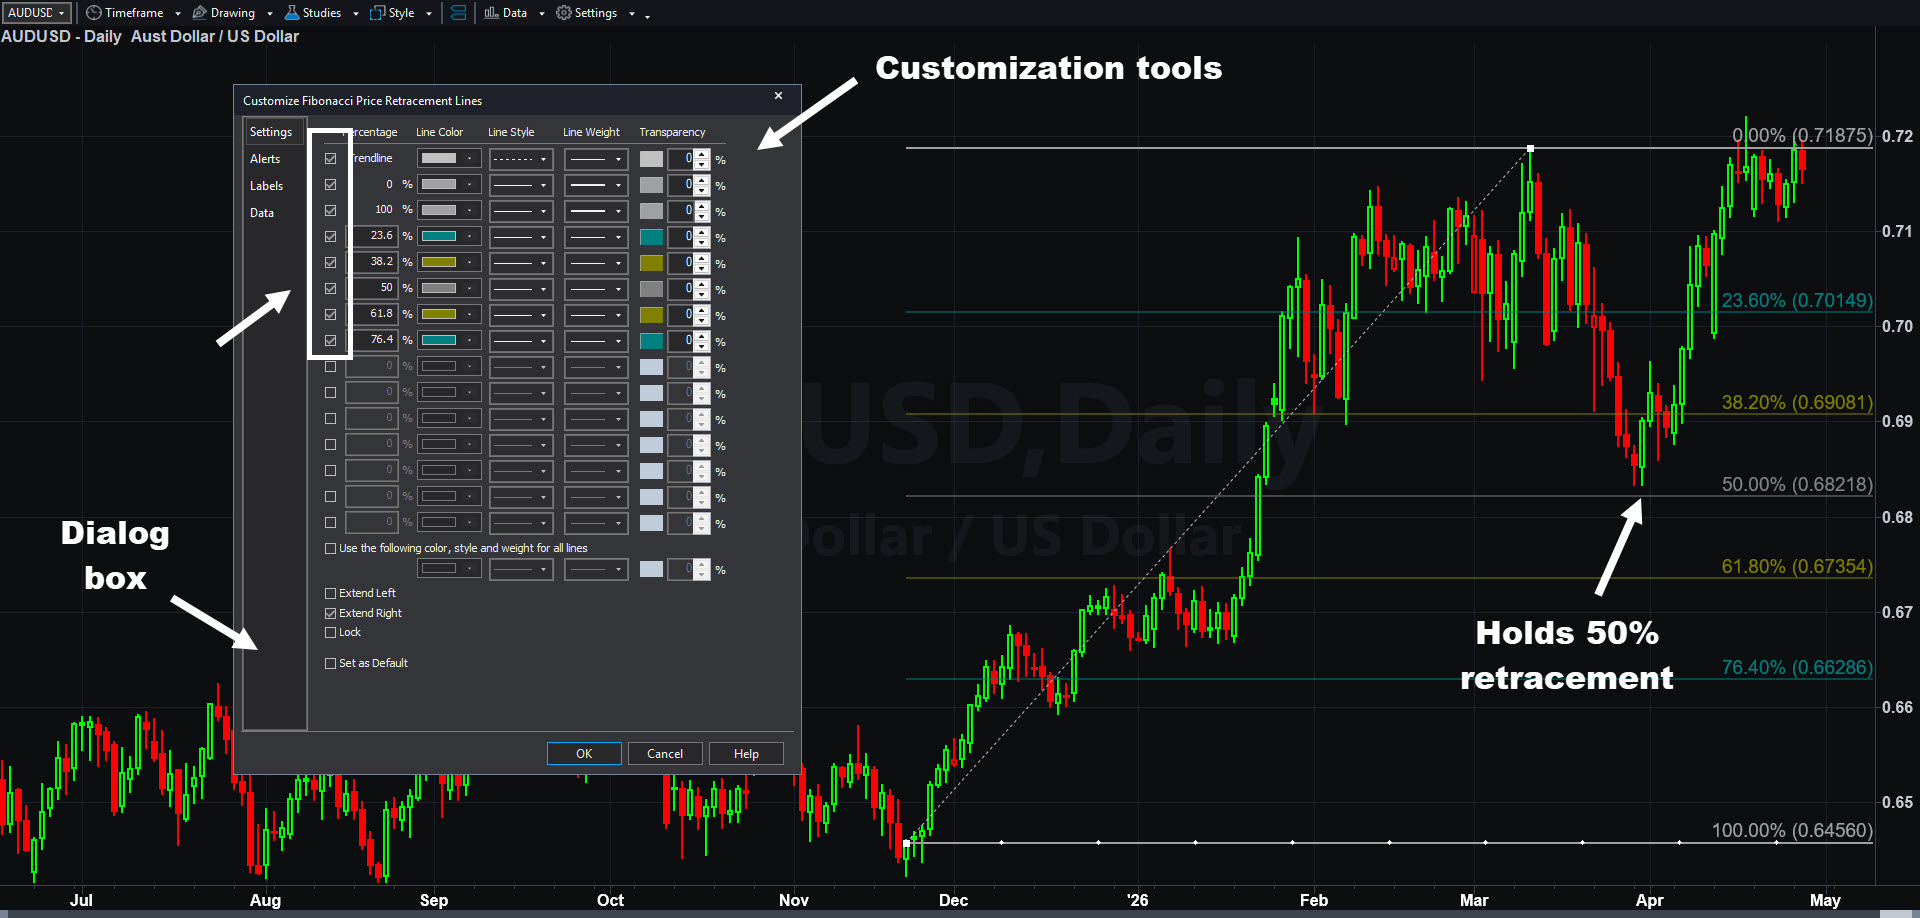
Australian dollar (AUDUSD), daily chart, showing recent Fibonacci retracement.
How to Use Fibonacci Retracement
Traders can access Fib retracements on TradeStation’s platform by following these steps:
- Click on the Drawing button (marked with a pen icon)
- Select “Fibonacci Price Retracement Lines.”
- Left-click on the starting price level. Release the button.
- Move the cursor to the ending price level.
- Left-click again. This will establish the range.
- You can drag the prices to adjust the top and bottom of the range.
Adjusting The Fibonacci Tool
You can adjust the drawing by right clicking on a line and selecting “Edit ‘Fibonacci Retracement Lines.’”
A dialog box will appear. You can make some of the following changes:
- Change the colors of the various retracement levels.
- Change the style of the lines (solid, dotted, dashed, etc.)
- Change the line weight (thickness) or transparency of Fib retracement lines.
- Hide lines using the check boxes to the left. (In case your chart is cluttered.)
- Tabs on the left also let you set alerts and change the fonts of the labels.
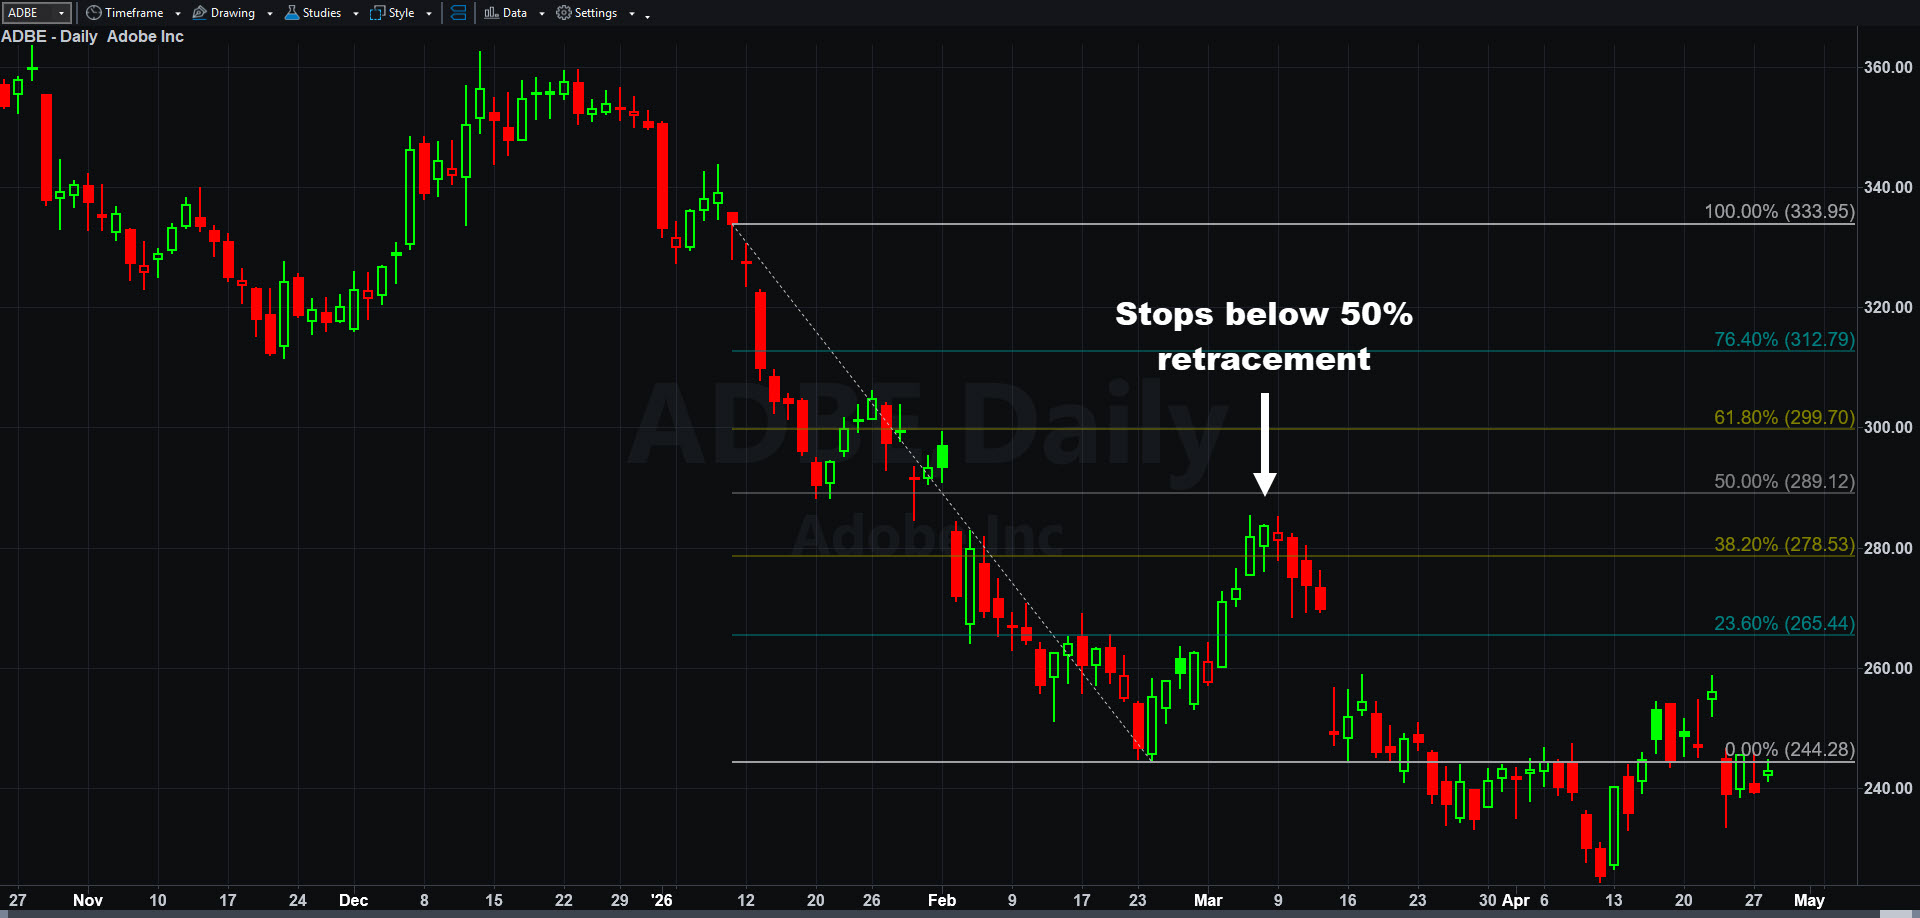
Adobe (ADBE), daily chart, showing bearish Fibonacci retracement in March.
Examples of Fibonacci Retracement
Markets don’t always move in a straight line. Pullbacks and counter-trend fluctuations often occur, creating potential opportunities for directional traders. This can be true for bullish or bearish moves.
Take energy stocks, for example. The S&P Energy Select Sector Index ($SIXE.X) rallied to new all-time highs in February and March as tensions grew in the Middle East. It stalled as a ceasefire took hold and pulled back for three weeks. However it bounced at almost exactly a 50 percent retracement of its advance. That gave a potential signal that prices were still ascending.
Adobe (ADBE), on the other hand, has been in a downtrend. It broke support in late January and slid to a new xx-year low a month later. Prices rebounded for about two weeks but stalled below a 50 percent retracement of the downward move. The software company then proceeded to a new long-term low, illustrating how trend followers can potentially utilize retracement levels.
In conclusion, Fibonacci retracements can be a useful tool for active traders in the stock market. Hopefully this article helps get you started with this technical analysis method.
IMPORTANT: The projections or other information generated by Fibonacci Retracement lines regarding the likelihood of various investment outcomes are hypothetical in nature, do not reflect actual investment results and are not guarantees of future results.
.jpg&w=3840&q=75)