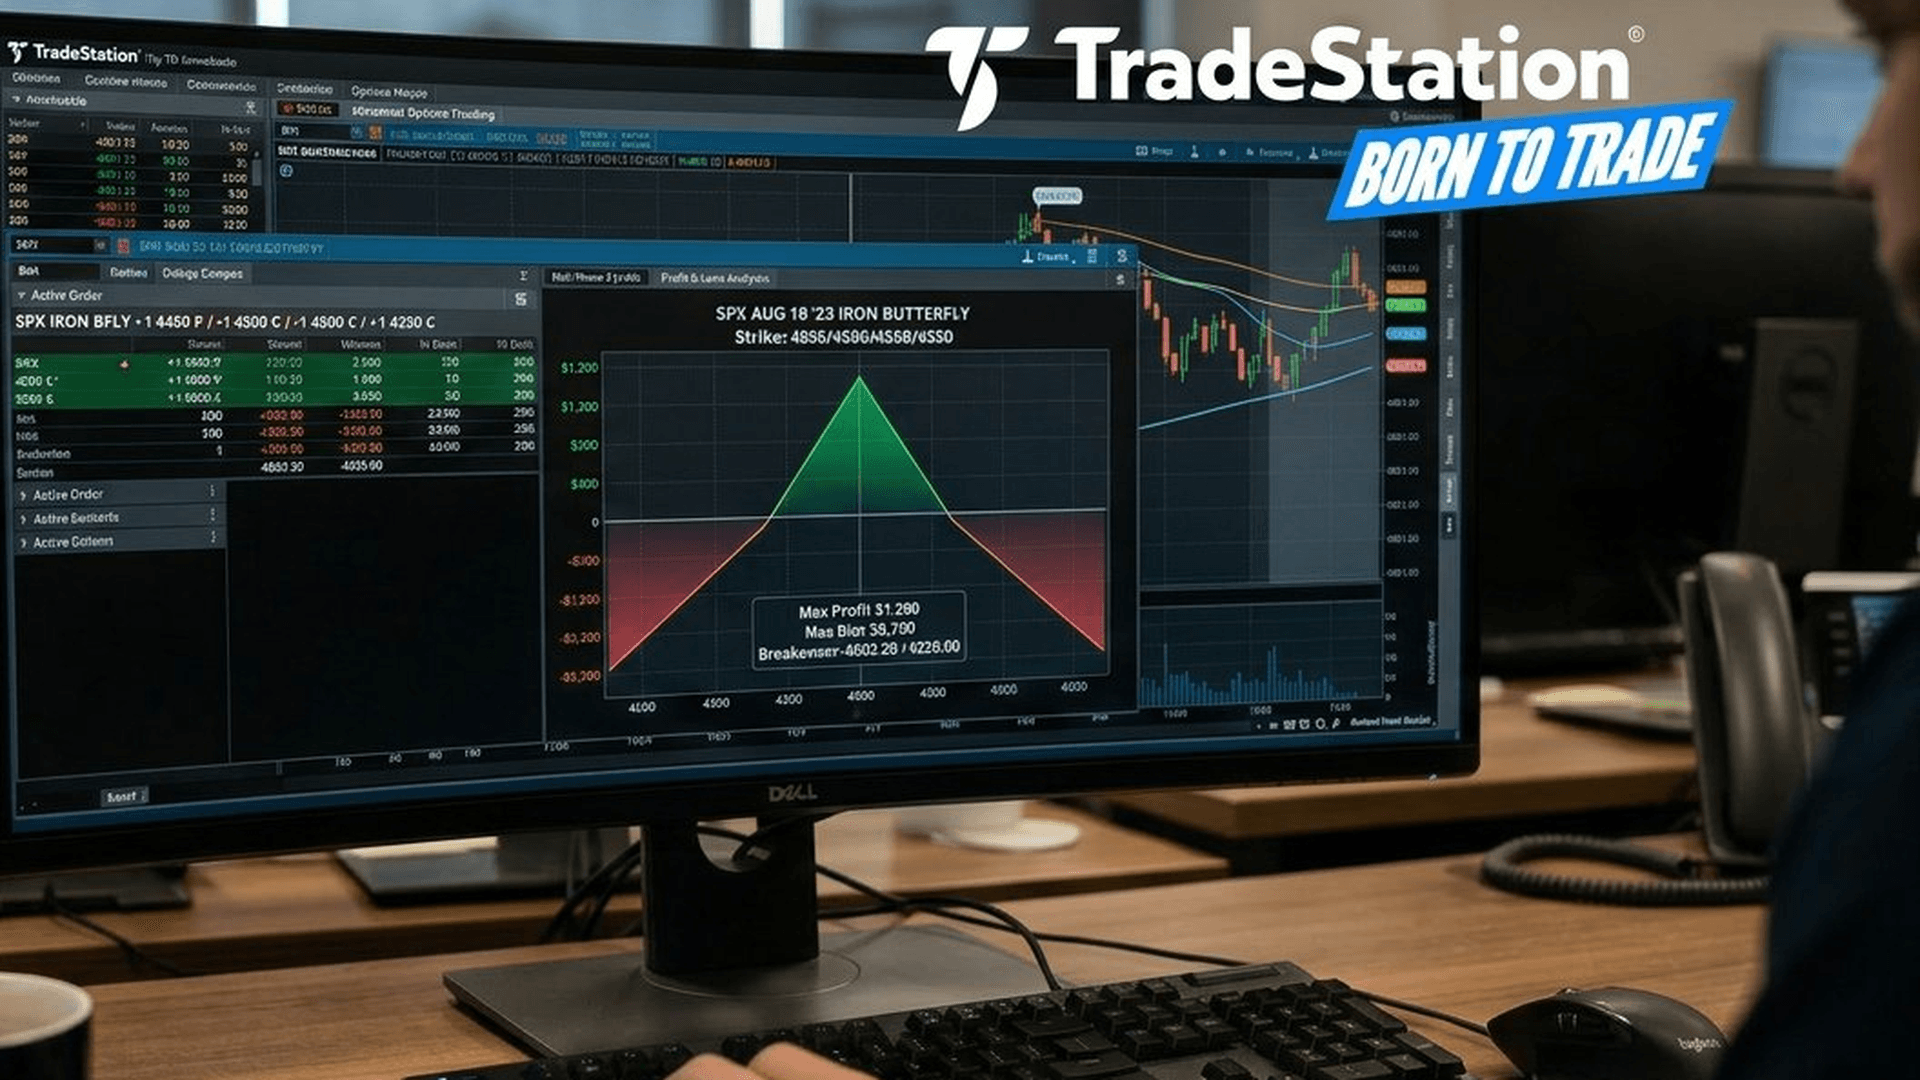
Bull calendar spread options: how to find the setup

The IV term structure is telling you something. Overall implied volatility is sitting in the lower third of its 52-week range, but front-month IV is running several points above the second month on your target ticker. The stock has been grinding higher on steady volume, approaching a strike that fits your directional thesis.
You know this is a classic bull calendar spread candidate. Buy the back-month call, sell the front-month call at the same strike, seek to collect the theta differential as front-month premium evaporates.
But you didn’t see the skew until it was almost gone. You were staring at single-expiration chains while the real opportunity, the volatility relationship between months, shifted without you.
By the time you manually compared IV across four expiration cycles, the skew had already narrowed. The setup was there. Your discovery process wasn’t.
The pivot: your calendar spread math is right, your screening isn’t
A bull calendar spread isn’t complicated. Buy a longer-dated call, sell a shorter-dated call at the same strike. You seek to profit from the theta differential as the front-month option decays faster than your back-month position. The position is net long vega, so a rise in implied volatility can work in your favor.
The complexity isn’t in the structure. It’s in finding the right setup at the right time.
You’re screening for a specific convergence: elevated front-month IV relative to back-month, a stock trading near your target strike, sufficient liquidity in both expiration months, and no catalysts inside your short expiration that could spike IV unpredictably.
Doing this manually across your watchlist? That’s the “retail tax.”cost you pay when the best calendar spread of the week surfaces and fades while you’re still toggling between expiration tabs.
The solution: how to find bull calendar spread options setups
1. Screening IV term structure for calendar spread candidates
Bull calendar spreads tend to perform best in two environments: when overall IV is low and expected to rise (you’re buying cheap options and benefiting from vega expansion), or when front-month IV is elevated relative to back-month (you’re selling expensive near-term premium against cheaper long-term protection).
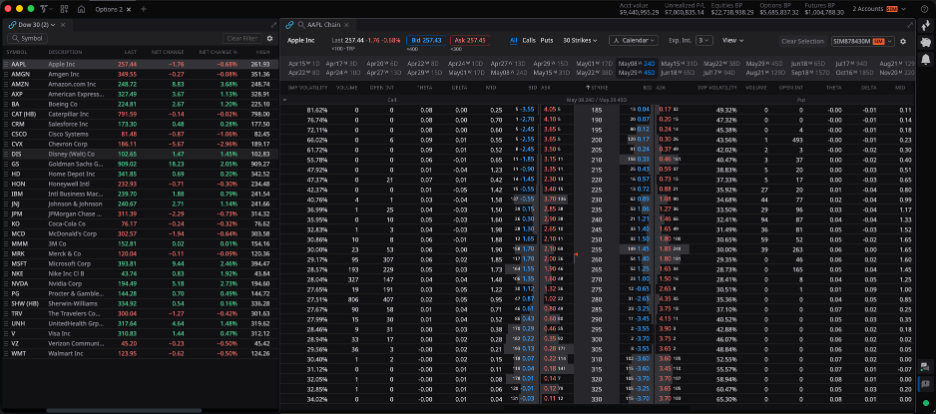
Pull up TITAN X. The options chain displays inline IV, Greeks, and probability metrics for every strike across every expiration. Click an expiration tab and the chain updates instantly. Compare front-month IV to the second month at a glance. Linked components mean clicking a symbol in your watchlist updates charts, Matrix, and options chain simultaneously.
For deeper IV analysis across multiple expirations, TradeStation connects with third-party partners including TradingView, Option Alpha, MultiCharts, QuantConnect, TradersPost, and ORATS.
You’re looking for IV skew between months (front elevated relative to back), liquid options with tight bid-ask spreads in both expirations, and a stock trading near a strike that fits your directional lean.
2. Identifying the strike and expiration window
The strike price determines your directional bias. ATM strikes create a neutral position with the widest profit zone. Strikes slightly OTM (one or two strikes above current price for calls) add a bullish lean, potentially profiting if the stock drifts higher toward the strike by front-month expiration.
For the short leg, target 21-30 DTE. Theta decay accelerates in this window, maximizing the rate at which front-month premium erodes. For the long leg, target 45-60 DTE, with enough remaining time value to retain significant extrinsic after the front month expires.
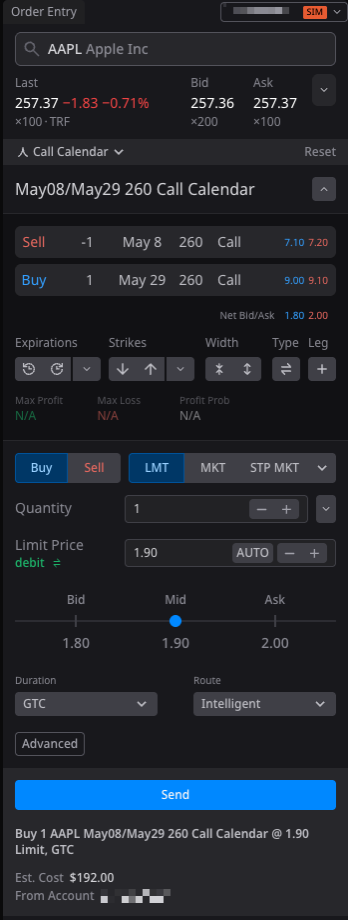
TITAN X’s spread selector lets you build the calendar from thestrategy menu. Both legs populate automatically: same strike, different expirations. The net debit displays inline before you commit.
On Desktop, OptionStation® Pro renders the full P&L curve across price and time, showing how theta decay and IV changes affect your position through expiration.
3. Building a watchlist of calendar spread candidates
One setup isn’t a strategy. Build a pipeline of candidates.
Create a TITAN X watchlist of tickers where you regularly trade options. Link the watchlist to your charts and options chain so clicking a symbol loads everything. Scan for tickers in low-IV environments where you expect a slow grind toward your target strike, or where a future catalyst could lift overall volatility. Some advanced traders also screen for event-driven term structure skew – earnings or macro announcements that inflate front-month IV relative to back-month – though these setups carry gap risk and shift the profit mechanism from theta decay to differential IV crush across expirations.
Set price alerts on the underlying to monitor when stocks approach your target strikes. Push notifications reach your phone even when you’re away from the desk.
Cross-platform sync means the watchlist you build on TITAN X appears on mobile. The position you enter from your desk shows real-time P&L on your phone. When adjustment time comes, you can close or roll the spread directly from the TradeStation Mobile App.
Open a TradeStation account and access the analysis tools bull calendar spreads demand.
4. Bull calendar spread entry criteria: the pre-trade checklist
Before you commit capital, run the setup through these filters:
- Is IV in the lower portion of its 52-week range, or is there a meaningful skew between front and back months?
- Is the stock trading near a strike that aligns with your directional thesis?
- Is the front-month expiration 21-30 DTE, where theta decay is accelerating?
- Is the back-month expiration 45-60 DTE, with enough cushion for the long call to retain value?
- Is the net debit acceptable relative to the max profit potential?
- If there are earnings inside your short expiration, is the IV skew pronounced enough to justify the gap risk?
If multiple answers are no, the setup probably isn’t ready.
Expert strategies: optimizing your bull calendar spread
Bull calendar spread strike selection: ATM vs. OTM
ATM strikes maximize the theta differential and produce the widest profit zone at front-month expiration. The position typically profits most when the stock pins at the strike. Slightly OTM strikes (1-2 strikes above current price for calls) reduce the debit but require the stock to drift higher for max profit. The trade-off is a narrower profit zone with a stronger directional lean.
Best IV environment for bull calendar spread options
Bull calendar spreads tend to benefit from IV expansion because the position is net long vega. The back-month option has higher vega than the front-month, so a rise in overall IV generally increases the value of your long position more than your short.
Ideal entry: IV rank below 30-40%, with an expectation that a catalyst will lift IV. For advanced traders: front-month IV elevated ahead of a known event (earnings, FDA, macro announcement) while back-month remains cheaper, creating a term structure skew you’re selling. Note that event-driven setups introduce gap risk and rely on differential IV crush rather than pure theta decay.
Rolling the short leg for additional income
If the stock holds near your strike and the front-month call expires worthless or near-worthless, you can sell a new front-month call against your still-active back-month call. This converts the position into a new calendar spread and can collect additional premium, potentially reducing your overall cost basis. Each roll extends your exposure but also adds risk if the stock moves away from the strike.
When to close a bull calendar spread
Many traders close at 50-75% of max profit to avoid gamma risk as front-month expiration approaches. If the stock has moved significantly away from the strike in either direction, the position loses its theta advantage and may be worth closing early to recover remaining value in the back-month option.
Bull calendar spread options risks: defined loss, real money
Bull calendar spreads have defined risk: your max loss is the net debit paid. But defined risk doesn’t mean insignificant risk. If the stock moves sharply away from your strike in either direction, both options lose value and the spread collapses toward zero. An unexpected IV crush (both months dropping simultaneously) hurts because you’re net long vega. The front-month option you sold can also be assigned early if it goes deep in-the-money, particularly around ex-dividend dates. Defined risk is real capital.
Stop scanning one expiration at a time
Bull calendar spreads can reward traders who see the volatility relationship between months, not just the price. Every hour spent manually comparing IV across expiration tabs is an hour the setup is evolving without you.
Build your watchlist. Screen for term structure skew. Let the platform surface the candidates.
Explore the Options Education Center for deeper strategy breakdowns.
Open your TradeStation account and start screening with professional tools.
Trade like you were born to do this.
ID5474496 P10616074609 D052026
Disclosure:
Options trading is not suitable for all investors. Your TradeStation Securities’ account application to trade options will be considered and approved or disapproved based on all relevant factors, including your trading experience. See www.TradeStation.com/DisclosureOptions. Visit www.TradeStation.com/Pricing for full details on the costs and fees associated with options.
Margin trading involves risks, and it is important that you fully understand those risks before trading on margin. The Margin Disclosure Statement outlines many of those risks, including that you can lose more funds than you deposit in your margin account; your brokerage firm can force the sale of securities in your account; your brokerage firm can sell your securities without contacting you; and you are not entitled to an extension of time on a margin call. Review the Margin Disclosure Statement at www.TradeStation.com/DisclosureMargin.
Hypothetical examples are for educational purposes only.