Stocks Crumble on Stagflation, War, Oil Shock

Chart of the Day: Is Transocean Trending Higher?
Transocean began the year with a steady rally. Now, after a brief period of consolidation, some traders may expect further gains.
Call toll-free 800.328.1267

Stocks have been crumbling as stagflation and war dominate sentiment.
The S&P 500 fell 1.6 percent between Friday, March 6, and Friday, March 13. The index has dropped for three straight weeks, its longest negative streak since last spring’s trade wars. Less than a quarter of its member stocks advanced.
The mix of price action seems to reflect growing anxiety. Financials led the selling and are headed toward their worst quarter since the 2022 bear market. Consumer discretionaries like retailers, automakers, homebuilders and travel stocks fell. That’s not a surprise with interest rates up and gasoline prices rising at the fastest pace since 2020.
Industrials, which previously surged on optimism about the economy, also fell sharply.
Meanwhile, most of the gainers reflect either shortages or fear. Energy stocks and fertilizer makers rallied as the war blocks supplies from the Persian Gulf. Utilities, a classic safe haven, also inched higher.
“The war in the Middle East is creating the largest supply disruption in the history of the global oil market,” the International Energy Agency said on Thursday. The organization added that production has already declined by 10 million barrels per day, with “supply losses … set to increase” unless the Strait of Hormuz is reopened quickly.
| Fair Isaac (FICO) | -23% |
| Centene (CNC) | -21% |
| Paramount Skydance (PSKY) | -19% |
| Ulta Beauty (ULTA) | -17% |
| Campbell (CPB) | -16% |
| Source: TradeStation data |
Wall Street sees the crisis boosting inflation and lowering economic growth. Goldman Sachs raised its headline inflation forecast by almost a full percentage point and cut its 2026 GDP estimate by 0.2 percentage point. The investment bank also moved its estimate for the Federal Reserve’s first rate cut from June to September.
Separately, the government slashed its estimate of fourth-quarter economic growth to just half the expected amount. Consumption, government spending and exports contributed to the change. Durable-goods orders for January showed more weakness the following month.
Consumer sentiment also missed estimates. The surveyors at the University of Michigan noted that responses improved before the war, only to drop once the fighting began. There was also weak demand for U.S. Treasury auctions, which is consistent with higher inflation and borrowing costs.
The combination of slowing economic growth and higher inflation is sometimes called “stagflation,” potentially reminiscent of the 1970s. It may create a double-risk for stocks because a weaker economy can slow earnings growth, while higher interest rates can depress multiples.
It comes as the credit market shows signs of strain after years of expansion. Morgan Stanley (MS) limited redemptions on one of its funds last week and JPMorgan Chase (JPM) lowered the value of some loans. The previous week, BlackRock (BLK) plunged on similar news.
This may create a new risk because investors entered 2026 expecting multiple Fed rate cuts. Fewer cuts could worsen the situation in private credit, hurting asset values and raising the cost of refinancing.
So you have higher rates, higher energy costs, weaker economic activity and increased credit risks. Has the rosy outlook for stocks diminished since the year began?
| SanDisk (SNDK) | +25% |
| Micron Technology (MU) | +15% |
| Ciena (CIEN) | +15% |
| CF Industries (CF) | +12% |
| Mosaic (MOS) | +11% |
| Source: TradeStation data |
The combination of higher interest rates and geopolitical risk is driving investors to the U.S. dollar, which just had its biggest two-week gain since 2022. That’s hammering global stocks, which had outperformed since early last year.
The strong dollar is also weighing on precious metals. Gold and silver miners led the selling last week and are experiencing their biggest monthly drops in over a decade.
Homebuilders fell as interest rates rose. Airlines slid as fuel costs rose. Retailers also had their biggest weekly drop in two years. Software companies continued lower after a two-week rebound.
Centene (CNC) fell sharply after saying that membership losses may be worse than feared as Obamacare subsidies disappear.
Ulta Beauty (ULTA) had its biggest weekly drop since the pandemic after earnings and comparable-sales guidance missed estimates.
Campbell (CPB) had its biggest weekly drop since at least 1968 after earnings and revenue missed estimates. Other food companies like ConAgra (CAG) and General Mills (GIS) fell the most this decade. Wells Fargo downgraded all three.
Separately, traders may see further risk to food companies if the Iran war drives up costs. (Fertilizer costs have already been rising.)
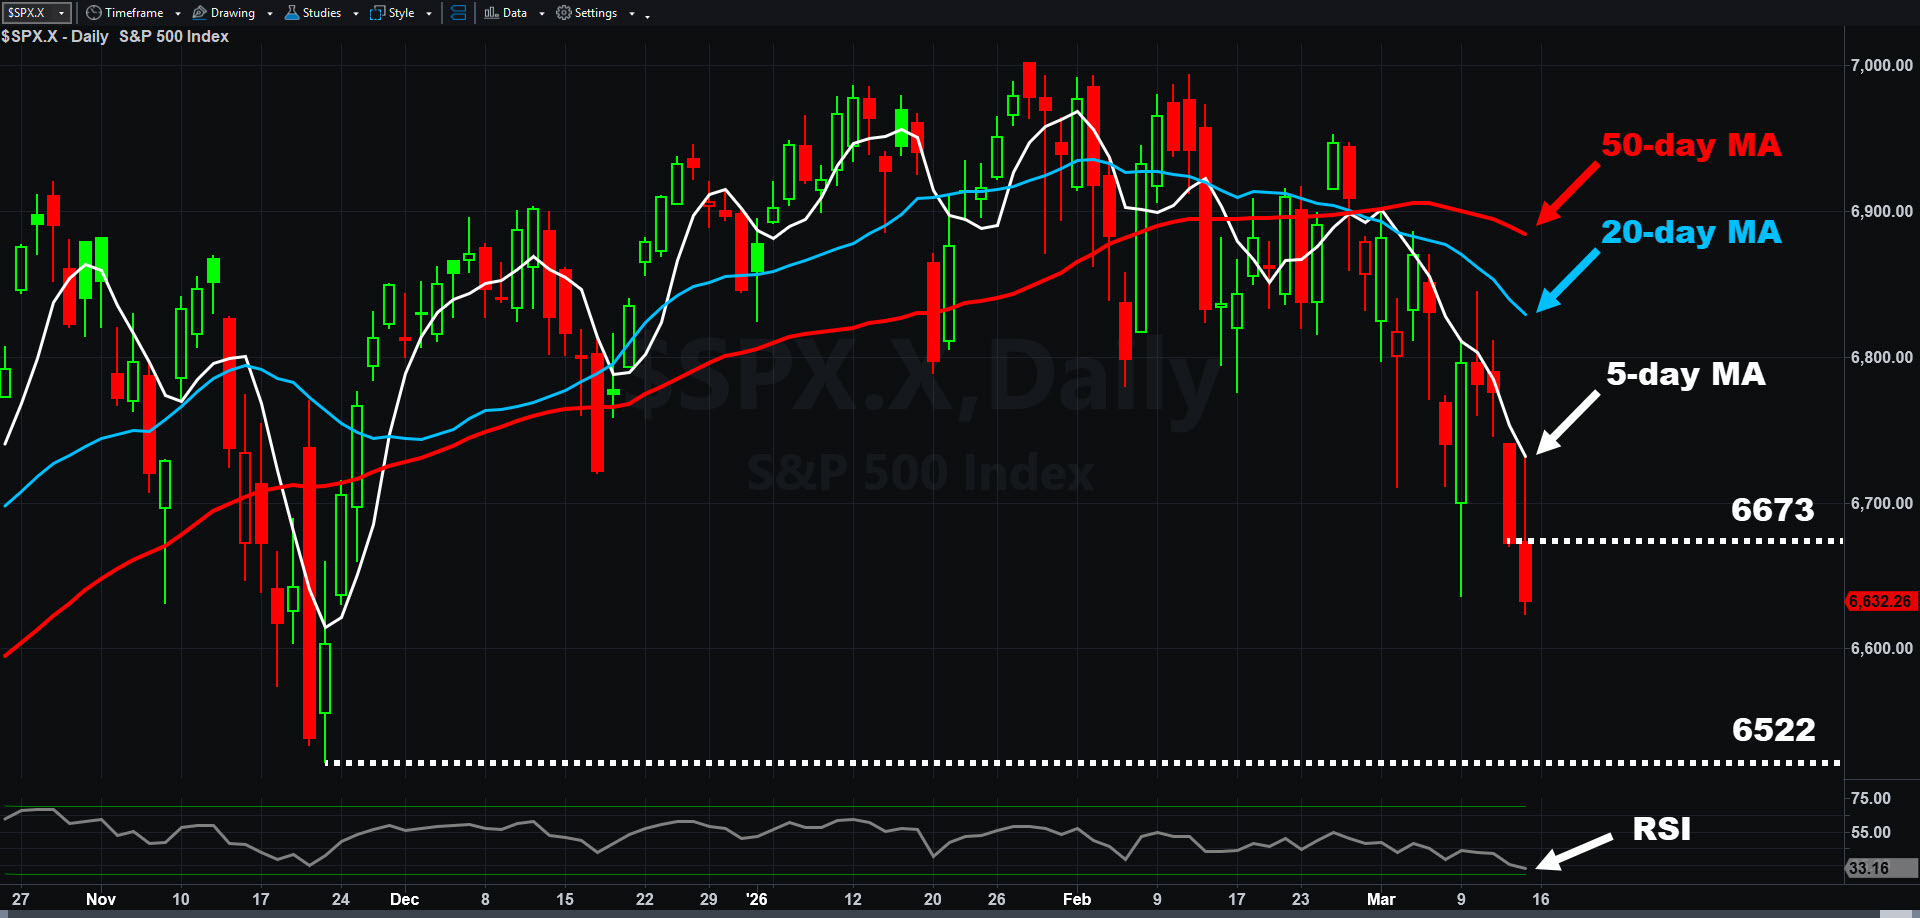
S&P 500, daily chart, with select patterns and indicators.
The S&P 500 has made small moves lower, and some traders could see risk of the bearish move accelerating.
For example, faster moving averages like the 5-day MA are below slower ones like the 20- and 50-day MAs. That’s a potential sign of a bearish short-term trend.
Bollinger Band Width is also starting to expand following a long period of tightness. That may suggest that volatility is increasing.
Next, the S&P 500 last week touched its lowest level in 75 days of price history. It was the deepest retrenchment since last April, contrasting with bullish periods when pullbacks are typically shallow.
The nine-day rate of change and Wilder’s Relative Strength Index (RSI) are also back to their lowest readings since the selloff last spring.
Two other things have happened for two weeks in a row on the weekly chart. First, the index made lower lows and lower highs. Second, the index closed below the previous week’s low.
Those two events differ from the price action since December, when the S&P 500 mostly moved sideways.
Traders watching key levels may eye support at the November low of 6,522. Resistance could be at Thursday’s close of 6,673.
The rising U.S. dollar is another potential risk.
Finally, of the 12 biggest companies by market cap, Broadcom (AVGO) is the only with its 8-day exponential moving average (EMA) above its 21-day EMA. That could reflect widespread short-term bearishness.
This week brings a few noteworthy events, although unscheduled geopolitical events and crude-oil news could remain major catalysts.
Industrial production, capacity utilization and NAHB’s homebuilder sentiment index are due this morning. Nvidia (NVDA) holds its GTC AI conference. CEO Jensen Huang’s keynote address at 2 p.m. ET is expected to include new product announcements and details on the Vera Rubin chip.
Pending home sales are tomorrow.
Wednesday is another big day, starting with crude oil inventories. The Fed announces interest rates and guidance on future policy at 2 p.m., followed by Chairman Powell’s press conference 30 minutes later. While the Fed meeting would normally be important, this one could matter less because monetary policy isn’t expected to change soon and Powell’s term is almost finished.
Micron Technology (MU) releases earnings after the closing bell.
Thursday brings a European Central Bank meeting, initial jobless claims, housing starts and building permits. Alibaba (BABA) and FedEx (FDX) report earnings.
Friday is quadruple witching day. (See this story for more.)

Transocean began the year with a steady rally. Now, after a brief period of consolidation, some traders may expect further gains.

The pain is growing on Wall Street as fighting escalates in the Middle East.

Vertiv has been a quiet beneficiary of the AI boom and now it’s getting noticed.