Tech Splits: Is the Megacap Trade Finally Over?

AI, Datacenter Unwinds Continue as Oracle Slides
Worries about Oracle weighed on several companies exposed to datacenter investment.
Call toll-free 800.328.1267

The technology sector could be splitting as investors focus on smaller chip stocks and abandon megacaps.
Micron Technology (MU) and SanDisk (SNDK) were the top-performing members of the S&P 500 in the holiday-shortened week between December 26 and January 2. Both are key players in the memory-chip market, which is surging as AI fuels data-center demand. They also trade at much lower multiples than trillion-dollar companies like Nvidia (NVDA) and Broadcom (AVGO).
Intel (INTC) ranked No. 3. It’s viewed as more of a comeback/value play, with valuation metrics far below larger peers.
Chip-equipment companies like Teradyne (TER) and hard-drive makers like Western Digital (WDC) also outperformed. They combined to lift semiconductors by more than 2 percent. However, the broader technology sector still fell 1.5 percent as money flooded away from high-multiple companies like software makers.
AppLovin (APP) and Palantir Technologies (PLTR) led the selling. Both trade for more than 50 times earnings and over 40 times sales, according to Yahoo Finance. Other high-multiple names like Carvana (CVNA, Tesla (TSLA) and Microsoft (MSFT) also fell.
Overall price action was consistent with a shift toward “value” stocks and a move away from classic “growth.”
See the table below for more on the divergence between high- and low-multiple tech stocks.
| Company | Price / Revenue |
Market Cap | Last week % | 1-month % | 3-month % |
| Micron Technology (MU) | 7.6x | $321B | +11% | +32% | +72% |
| SanDisk (SNDK) | 4.4x | $35B | +10% | +34% | +122% |
| Intel (INTC) | 3x | $176B | +8.8% | -9.4% | 5.6% |
| Western Digital (WDC) | 6x | $59B | +3.4% | +17% | +43% |
| Nvidia (NVDA) | 24x | $4.4T | -0.9% | +4.1% | 0% |
| Broadcom (AVGO) | 26X | $1.6T | -1.3% | -8.9% | +2.8% |
| Microsoft (MSFT) | 12x | $3.6T | -3% | -3.5% | -8.3% |
| Palantir Technologies (PLTR) | 115x | $423B | -11% | -1.7% | -10% |
| Meta Platforms (META) | 9x | $1.7T | -1.9% | +0.5% | -11% |
| Tesla (TSLA) | 17x | $1.5T | -7.8% | +2.1% | +0.5% |
| Sources: TradeStation data, Yahoo Finance |
The divergence comes as the market positions for a stronger economy in 2026. The Federal Reserve last month hiked its GDP growth forecast from 1.8 percent to 2.3 percent. Goldman Sachs is targeting 2.6 percent growth, making the U.S. one of the few major economies to accelerate from 2025.
Economists point to tax refunds, the combined effects of interest-rate cuts and less drag from tariffs. (Just last week, the White House delayed raising duties on furniture and reduced proposed taxes on Italian pasta.)
Moderating inflation could be another factor:
The economy could remain important this week and next, with key payrolls data on Friday and inflation on January 13. After that, corporate earnings may take center stage.
“We’re in the boom stage” and not a bubble, Citi equity strategist Scott Chronert told CNBC on December 30. He expects “a broadening into other sectors that we think will add up to a very constructive earnings picture for 2026.”
Energy, a classic “value” sector that can benefit from a strong economy, was the top sector last week. It also climbed on geopolitical worries.
Chinese stocks rebounded on AI news. Baidu (BIDU) jumped 20 percent on plans to spin off its AI chip division Kunlunxin. Biren, another Chinese AI chip stock, rallied more than 80 percent after an initial public offering. DeepSeek separately issued a whitepaper on Manifold-Constrained Hyper-Connections (mHC), which may lower AI training costs.
Utilities, which are raising rates as data centers increase electricity demand, also climbed. Solar energy and industrials gained as well.
Consumer discretionaries — dominated by TSLA and Amazon.com (AMZN) — and tech led to the downside. Financials pulled back after hitting new highs before Christmas.
Precious metals like gold and silver also saw profit taking after big rallies in November and December.
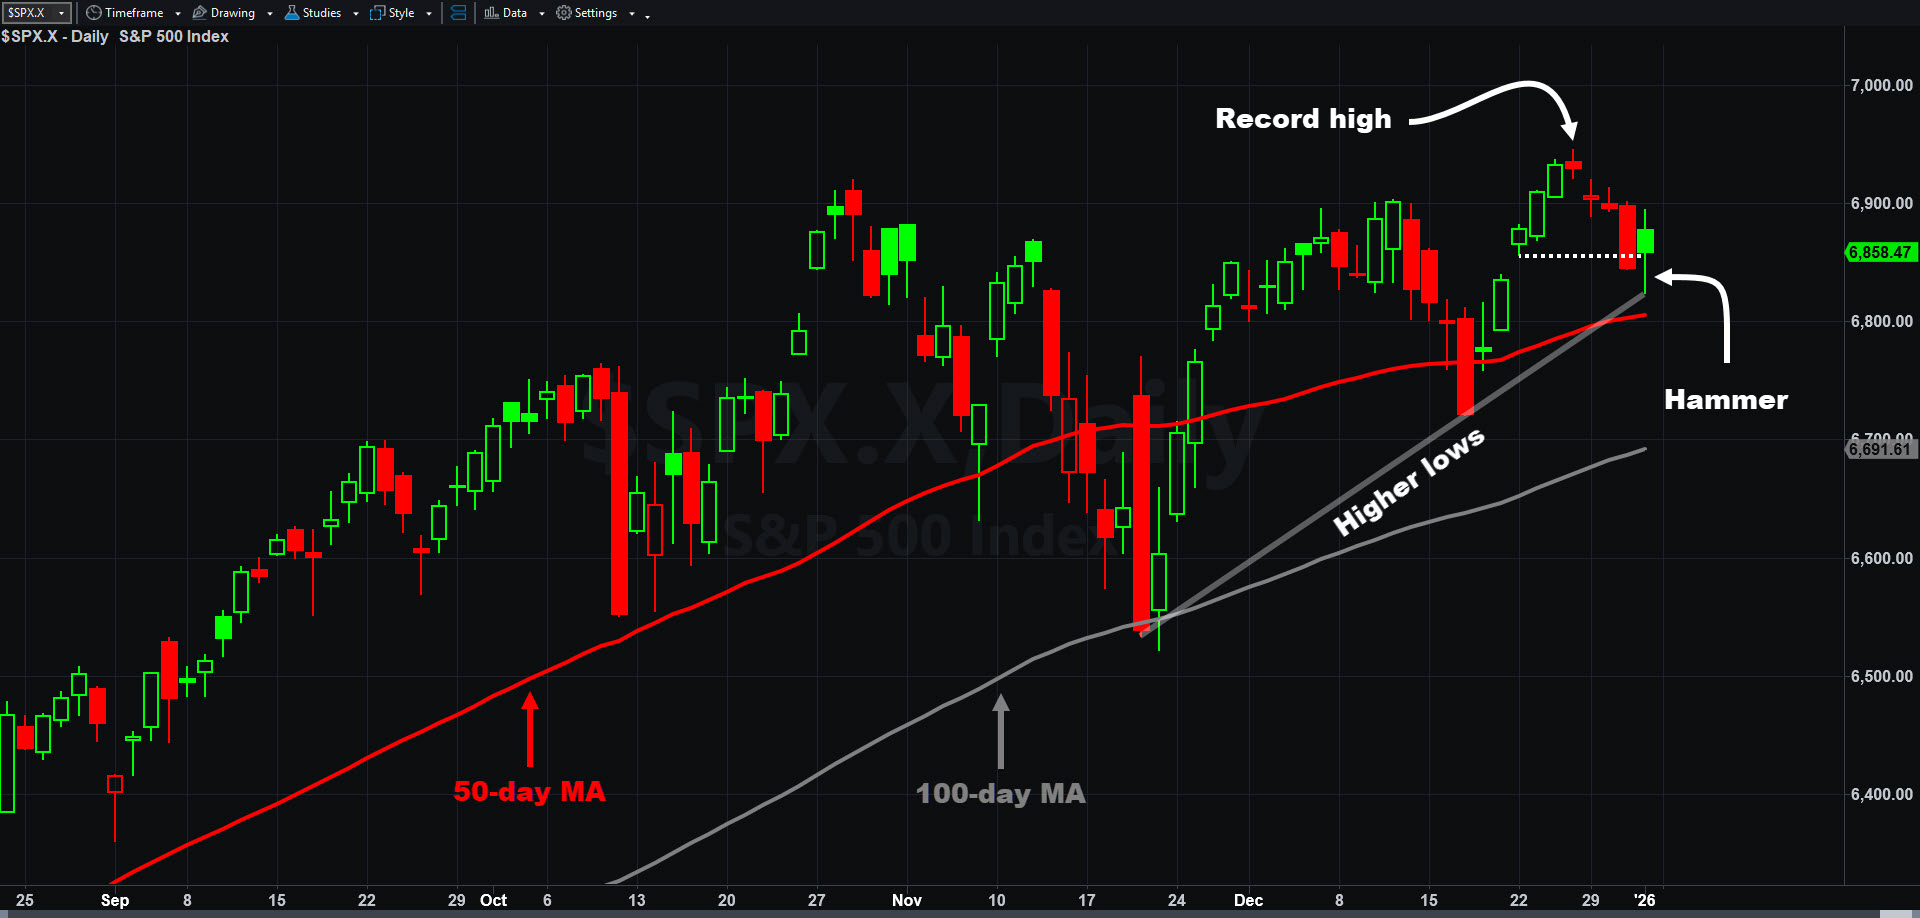
S&P 500, daily chart, with select patterns and indicators.
The S&P 500 fell 1 percent last week. It was down fractionally in December, the first negative month since April.
The index has been mostly rangebound since October, but some chart watchers may see potential for a move to new highs.
First, prices have made higher lows since mid-November. They initially bounced at the 100-day moving average. A month later, they tested below the 50-day MA before rebounding. Last week they potentially held support above the 50-day MA. Those shallower pullbacks may reflect steady buying pressure.
On Friday, the index fell into a gap from December 22 before clawing back to close above it. Prices also formed a “hammer” candlestick. Such patterns may suggest new support is being established.
Last week’s bounce also came after the S&P 500 retraced a little more than half its preceding move.
This week brings a mix of events relating to the technology sector and economy.
The Institute for Supply Management’s manufacturing index is due this morning.
The Consumer Electronics Show (CES) begins tomorrow and runs through Friday. It may focus attention on tech stocks.
Wednesday features ADP’s private-sector employment report, ISM’s service sector index, job openings (JOLTs) and crude-oil inventories. Applied Digital (APLD) and Constellation Brands (STZ) report earnings in the afternoon.
Initial jobless claims are on Thursday.
Friday brings the key non-farm payrolls report.

Worries about Oracle weighed on several companies exposed to datacenter investment.

Alphabet has pulled back after hitting a new all-time high, and some traders may think it’s oversold.

AI stocks are falling as negative headlines mount, but financials and industrials hit new highs.