Using AI With Dynamic Market Data

Analyzing Markets with Advanced Charting on TITAN X
Learn to use technical studies, customizable charting tools, and drawing features in TITAN X.
Call toll-free 800.328.1267

This is the second in a series of articles on AI and investing. Here’s a link to our previous post.
Artificial intelligence is already changing the landscape of corporate America, boosting productivity and results at a growing number of companies. Today we’ll consider how it can potential boost your productivity and results as a trader. In particular, this article will explain how data from TradeStation can be systematically combined with AI.
We used the same three large language models: ChatGPT 4.0, Perplexity and Grok. They performed similarly answering the questions below. (Marked in blue text.)
Next, remember that AI has limits. Large language models (LLMs) mostly process textual data and can be influenced by old information they learned in their training. They aren’t designed to handle these kinds of jobs, which is why we carefully refined and tested prompts to generate relevant outcomes. Below are two kinds of questions for AI models: short-term and intermediate-term. We’ll use them to learn about stocks discovered by TradeStation’s powerful analytic tools.
Customers can discover moving stocks with TradeStation’s tools (explained below) and immediately research the tickers. Users can open a new AI session and use it exclusively for this work, keeping the model focused on a single kind of input and output. This prompt can be used for understanding short-term movers that are rising or falling today:
The goal is to feed the model a series of tickers, each in its own query. (Multiple tickers at a time can reduce the thoroughness of search on each.) We’re now ready to quickly progress through a list of tickers. Generating such a list is the next task.
TradeStation offers several tools for discovering stocks on the move. The first is Hot Lists, which can be accessed from the Apps button at the top left of the desktop. ![]() Hot Lists has a series of dynamically updated searches for stocks displaying unusual fluctuations in price, volume or options activity. Most of the relevant searches will be found under the “Equities” group in the Asset field. In the Activity field, users can expand the “Price Lists” folder to find several relevant lists. Some of these include:
Hot Lists has a series of dynamically updated searches for stocks displaying unusual fluctuations in price, volume or options activity. Most of the relevant searches will be found under the “Equities” group in the Asset field. In the Activity field, users can expand the “Price Lists” folder to find several relevant lists. Some of these include:
Next is RadarScreen®, which can perform calculations on a list of provided symbols. It can also be opened from the App button. ![]() Customers can next click on Data → Add Symbol List → S&P 500 to populate all the companies in the S&P 500 index. They can then sort by the column “Net %Chg” to find stocks that are up or down significantly in the session.
Customers can next click on Data → Add Symbol List → S&P 500 to populate all the companies in the S&P 500 index. They can then sort by the column “Net %Chg” to find stocks that are up or down significantly in the session.
Both of these techniques will typically provide multiple stocks that are making sharp moves. These can be passed to the AI models using the method described above, letting customers consistently and systematically discover stocks. The reasons for their movement will be quickly understood, giving a starting point for further research and planning.
The query above is intended for short-term movers that could be rising or falling in the last week. Other stocks may be appreciating (or declining) over longer time frames of months and quarters. These may offer opportunities for longer-term trend following. However, the reasons for their moves may lie further in the past and require different kinds of AI prompts.
This query tells the model to survey longer periods of time and to favor certain kinds of news. This helps it overlook irrelevant headlines and focus on the kinds of stories more likely to explain stock movement. It also reiterates key instructions like avoiding charts and knowledge from its training.
Scanner can help us identify stocks for this kind of prompt. ![]() It can be access from the Apps button. Once it’s open, customers can follow these steps:
It can be access from the Apps button. Once it’s open, customers can follow these steps:
These criteria will find stocks that have appreciated significantly in the last year, but declined in the last four weeks. These pullbacks may present opportunities to enter before uptrends potentially continue. The AI prompt above will look far enough back in time to discover the reason for the longer-term move move.
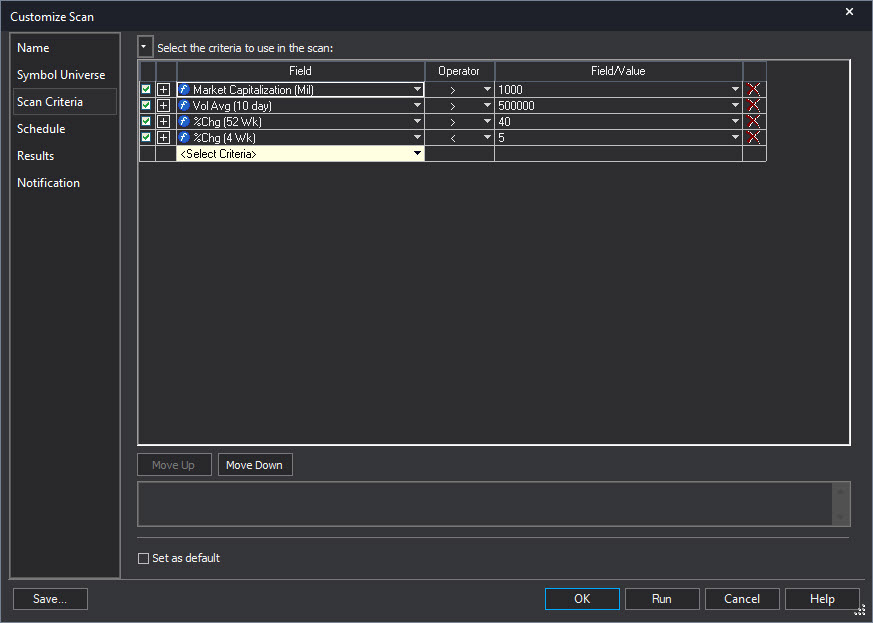
Scanner app, showing criteria listed above.
The steps listed use two different technologies, leveraging the strengths of each to help you understand market conditions.
We draw market data from TradeStation, which lets us perform powerful and customized searches. AI models, on the other hand, have spotty access to market data and cannot easily perform calculations for large numbers of stocks.
Second, we use the AI tools where they have a clear advantage: digesting and summarizing large amounts of text according to specific instructions.
As a result, we draw on the strengths. We also avoid a weakness of AI (confusion and hallucination) by focusing it with real data and strict prompts. Focusing on a single company at a time can additionally improve results.
In conclusion, AI was created to help with text generation — not financial analysis. However, it can be combined with older market-data technology to produce large amounts of useful and actionable insights. It’s another example of how new applications are constantly emerging in this fast-evolving field.

Learn to use technical studies, customizable charting tools, and drawing features in TITAN X.

Explore how FuturesPlus supports futures spread trading with tools for product discovery, advanced filtering, MD Trader execution, Spread Matrix visualization, and custom spread construction using Auto Spreader. Review how to analyze and manage both exchange-listed and synthetic spreads within a structured trading workflow.

The market’s been grinding higher for a week. Your technical thesis is strong: support is holding, volume is confirming, and the stock looks like it wants to base here before the next leg up. You’re not looking for a home run. You want a put credit spread that...