How to Track Trades and Generate Account Reports

Analyzing Markets with Advanced Charting on TITAN X
Learn to use technical studies, customizable charting tools, and drawing features in TITAN X.
Call toll-free 800.328.1267
Tracking performance is a key task for active traders. This article will explain how customers can access and analyze activity in their TradeStation Securities account.
Traders can begin at the homepage, TradeStation.com and click the “Sign in” button in the main navigation bar at the top.
After providing credentials, customers will see the main dashboard of HUB. They can always navigate back to this view by clicking on the home icon at the top left.
Key stats like account value, profit and loss (P/L) and available cash appear along the top. There’s also an equity curve, or chart showing historic changes in the account’s value. A drop down menu above the chart lets customers change accounts, while the Aggregate button combined values across all accounts.
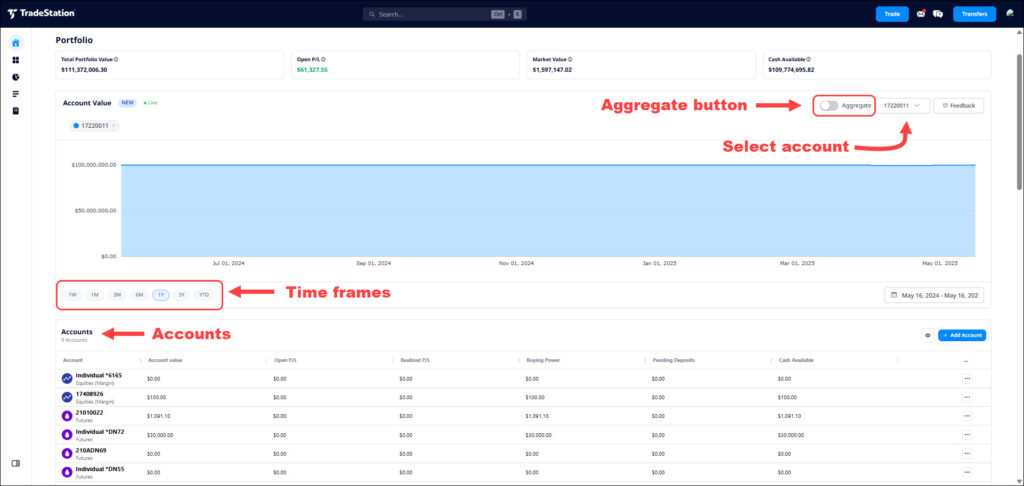
Client HUB’s main dashboard, showing key account information.
The account value chart is the first tool for traders looking to track their performance or generate reports on their activity. Notice the time-frame buttons at the bottom left letting users view periods such as 1 week, 1 month, 3 months, etc.
Each account is listed in a section below the equity curve chart. Customers seeking more details can click on an account and a pop-up window will appear.
This window offers several key pieces of information, controlled by the buttons at the top:
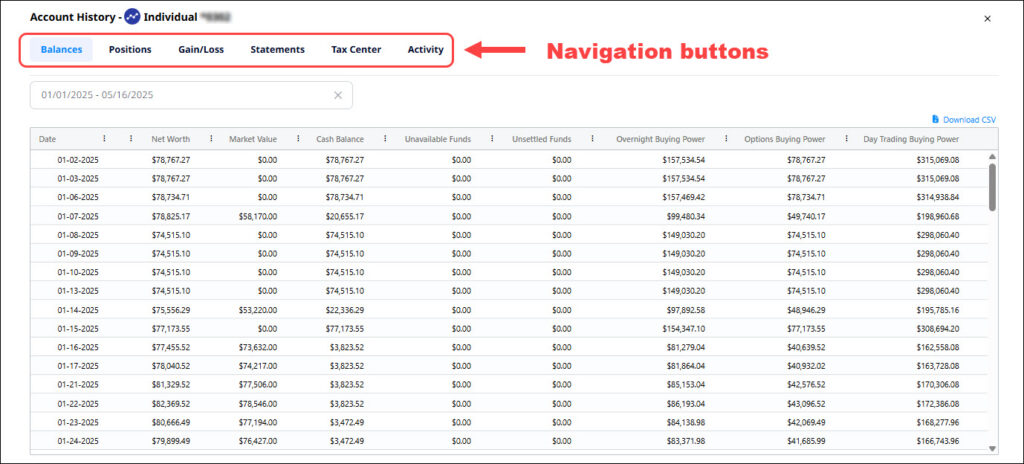
Account history, showing balances over time.
ID4511279 D0525

Learn to use technical studies, customizable charting tools, and drawing features in TITAN X.

Explore how FuturesPlus supports futures spread trading with tools for product discovery, advanced filtering, MD Trader execution, Spread Matrix visualization, and custom spread construction using Auto Spreader. Review how to analyze and manage both exchange-listed and synthetic spreads within a structured trading workflow.

The market is quiet. Too quiet. Implied volatility is sitting at the floor. The VIX is compressed. The 30-day realized vol on your watchlist is grinding near its 52-week low. But you know what’s coming. The economic calendar says the FOMC meeting is in three days. CPI...