Health Care's Historic Collapse
Downloads are available here. TradeStation’s ideas on TradingView are available here.
Check out our next “State of the Market,” on Monday, 5/19.
Sizing Up the Market
- S&P 500 sitting at 5860-5994 price range from February 27 – March 3.
- March 25 peak of 5787 is potentially in play
- Intermarket:
- 10-year Treasury ended yesterday above 4.5% for 1st time since late-February
- 5/28: Fed minutes, NVDA earnings
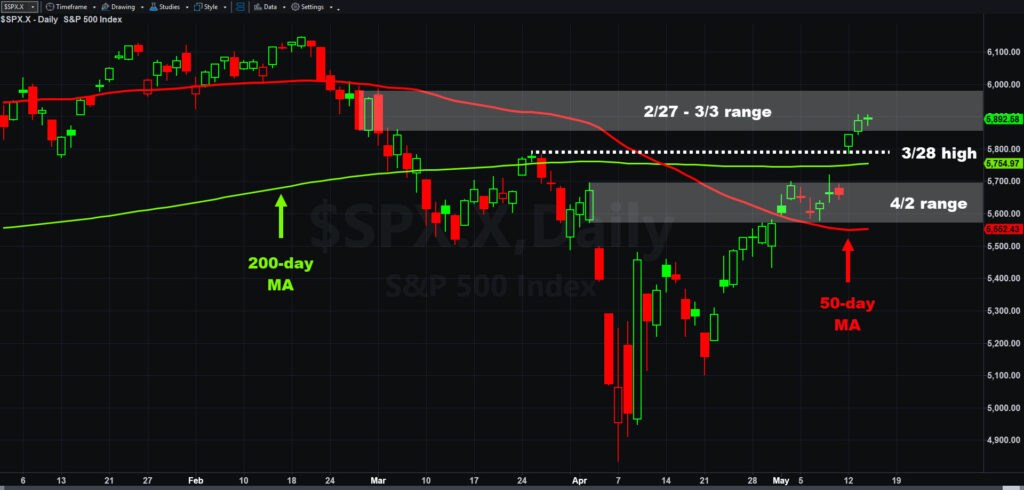
S&P 500, daily chart, with select patterns and indicators.
Health Care Collapses
- S&P Select Health Care SPDR ETF (XLV) has lagged the S&P 500 by 13 percentage points in the last 10 sessions.
- That’s the biggest underperformance since XLV launched in December 1998.
- MRNA: Guidance cut as vaccine demand weakens, FDA appoints Prasad
- UNH: Increased patient usage, CEO departure highlight difficult future
- UNH in midst of biggest monthly drop since 2009
- Medicaid cuts
- Medicare reimbursements
- Prescription-drug pricing
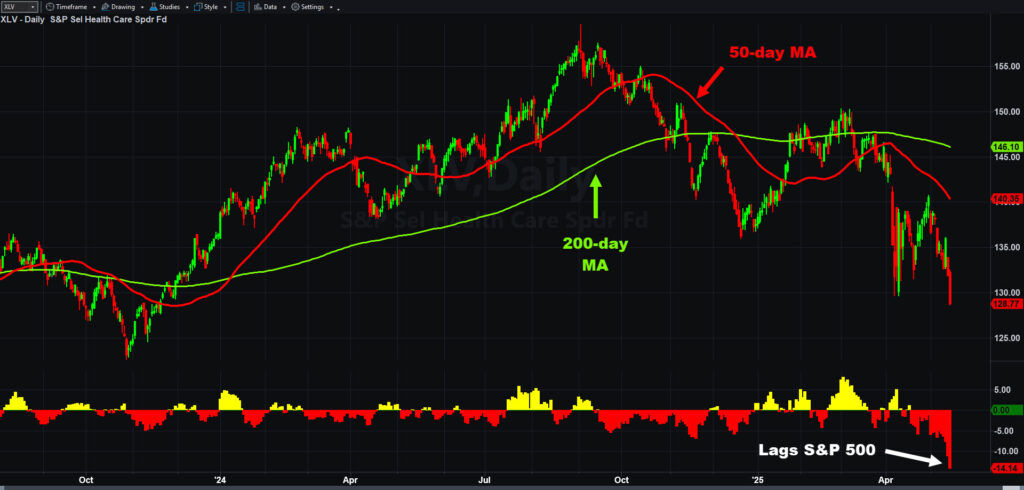
S&P Select Health Care SPDR ETF (XLV), daily chart, with select patterns and indicators.
News & Views
- AI stocks gain on multiple catalysts
- NVDA, AMD providing technology for Saudi AI company Humain
- AMD announces $6bln share buyback
- SMCI secures $20bln project with Saudi datacenter company DataVolt
- A big step for “sovereign” enterprise market?
- S&P 500 target: 5,900 → 6,100
- Another hearing next week. Ruling possible in coming weeks.
Upcoming Events
- Earnings tonight: AMAT CAVA TTWO
- Fri 5/16: Housing starts / building permits, consumer sentiment
- Tue 5/20:
- Earnings: HD | PANW
| ETF | 1 Year | 5 Years | 10 Years |
| S&P Select Health Care SPDR ETF (XLV) | +0.1% | +40.85% | +98.1% |
| As of April 30, 2025. Based on TradeStation Data |
Exchange Traded Funds (“ETFs”) are subject to management fees and other expenses. Before making investment decisions, investors should carefully read information found in the prospectus or summary prospectus, if available, including investment objectives, risks, charges, and expenses. Click here to find the prospectus.
Performance data shown reflects past performance and is no guarantee of future performance. The information provided is not meant to predict or project the performance of a specific investment or investment strategy and current performance may be lower or higher than the performance data shown. Accordingly, this information should not be relied upon when making an investment decision.
.jpg&w=3840&q=75)


