Futures Education Center
Understanding Crack Spreads: A Guide to Energy Futures Trading
Energy futures markets offer traders numerous opportunities to profit from price movements in crude oil and refined petroleum products. Among these opportunities, crack spreads have emerged as one of the popular strategies for expressing views on refining margins and the relationship between raw materials and finished goods. For traders interested in exploring energy commodity spreads, understanding the mechanics, benefits, and risks of crack spreads provides an essential foundation for informed decision-making.
What are crack spreads?
The term “crack spread” originates in the petroleum refining industry, where crude oil’s complex hydrocarbon chains are “cracked” under intense heat and pressure to produce refined products such as gasoline and diesel fuel. In futures markets, a crack spread represents the differential between crude oil prices and the prices of its refined products. This differential reflects the theoretical gross margin that oil refiners earn from converting crude oil into more valuable consumer products.
The most widely recognized crack spread is the 3:2:1 ratio, which mirrors the typical output of U.S. refineries. This ratio reflects that three barrels of crude oil generally yield approximately two barrels of gasoline and one barrel of distillate fuel, which can be either heating oil or diesel. When calculated, the 3:2:1 crack spread provides a snapshot of refining profitability. For example, if gasoline trades at $1.73 per gallon, heating oil at $2.11 per gallon, and crude oil at $54.22 per barrel, the theoretical refining margin would be approximately $23.76 per barrel.
We should examine the calculation of the refining margin to better understand it. We begin by converting all products to a per-barrel (bbl.) basis, using 42 gallons per barrel.
- Gasoline: $1.73/gal x 42 gal/bbl. = $72.66/bbl.
- Heating oil: $2.11/gal x 42 gal/bbl. = $88.62/bbl.
- Crude oil is already quoted as $54.22/bbl.
The 3:2:1 crack spread involves processing three barrels of crude oil to yield two barrels of gasoline and one barrel of heating oil. Next, we will calculate the total revenue from the refined products using the correct ratio. The revenue would be 2 barrels of gasoline at $72.66/bbl. plus 1 barrel of heating oil at $88.62, totaling $233.94.
2 barrels at $72.66/bbl Gasoline + 1 barrel at $88.62 Heating Oil = $233.94
The total cost of the crude oil input is 3 barrels x $54.22/bbl. = $162.66. The final step is to calculate the refining margin by subtracting the total cost from the total revenue and divide the result by the number of barrels processed. So, the revenue is ($233.94 – $162.66) / 3 barrels, or $23.76/bbl.
Fortunately, the TradeStation FuturesPlus platform can calculate and chart the crack spread for you. First, create it using the Autospreader® widget. Enter the three contracts you wish to trade, along with their correct expiration months. In the ratio row, enter -3 for crude oil, 2 for gasoline, and 1 for heating oil. In the multipliers row, enter -1 for crude oil, 28 for gasoline, and 14 for heating oil. This will ensure accurate calculations for trading the 3:2:1 crack spread.
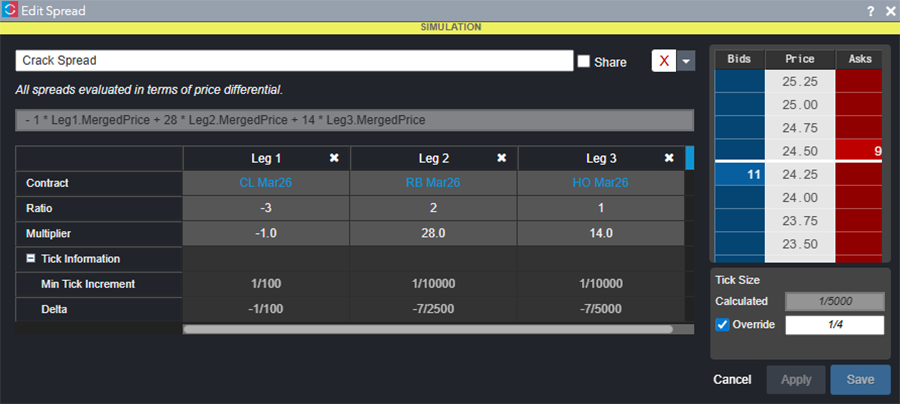
Once you have created the crack spread in the Autospreader®, you can open a chart, MD Trader, or Market Grid to analyze and trade it.
Traders may also encounter the 5:3:2 crack spread, which assumes five barrels of crude oil produce three barrels of gasoline and two barrels of distillate. This variation proves particularly relevant when analyzing refineries that process heavier crude grades or during winter months when heating fuel demand increases. Some retail futures traders prefer simpler one-to-one crack spreads between crude oil and a single refined product, particularly when technical analysis identifies mispricing or tradable chart patterns between the contracts.
Why trade crack spreads?
Crack spreads offer several potential advantages compared to trading outright crude oil futures positions. Understanding these benefits helps traders determine whether spread strategies align with their trading objectives and risk tolerance.
First, spread positions typically require less margin than holding equivalent outright positions in each contract. The New York Mercantile Exchange recognizes that holding both long and short positions in related commodities simultaneously reduces overall portfolio risk. As a result, exchanges often provide margin credits ranging from 50 to 65 percent compared to the combined margin requirements of trading each leg separately. This margin efficiency allows traders to deploy capital more effectively across multiple positions or maintain larger reserves for risk management.
Second, academic research suggests that spread positions may experience lower volatility than outright crude oil positions. Because fundamental factors often influence both crude oil and refined products in similar directions, the differential between them tends to fluctuate within more defined ranges than the absolute price of crude oil itself. However, traders should recognize that lower volatility does not eliminate risk, and spreads can still experience dramatic price swings during periods of market disruption.
Third, crack spreads often exhibit more predictable seasonal patterns than crude oil prices alone. Gasoline crack spreads typically strengthen between March and August, coinciding with increased driving activity during the summer vacation season. Heating oil spreads tend to widen from October through February as demand for heating fuel rises in northern climates. These seasonal tendencies can provide a framework for timing potential trade entries and exits, though past patterns never guarantee future results.
Understanding margin requirements and leverage
Margin in futures markets functions differently than in stock trading. Rather than representing borrowed money, futures margin serves as a performance bond, a good-faith deposit that ensures traders can meet their contractual obligations. Futures brokers establish two margin levels: intraday margins for positions closed before the settlement period and overnight margins for positions held past the close.
Current overnight margin requirements for selling WTI crude oil futures at TradeStation typically run around $4,500 per contract, while buying RBOB gasoline and heating oil contracts require approximately $5,000 to $5,800 each. The combined margin for holding outright positions in three crude oil contracts short, two gasoline contracts long, and one heating oil contract long would be about $28,000. However, because exchanges recognize the reduced risk profile of spread positions, a 3:2:1 crack spread might require about $4,800, roughly 83% less margin than holding the individual components separately. The spread margin requirement can be calculated using the CME Group’s Margin Calculator on its website.
This margin efficiency creates substantial leverage. A single crude oil contract controls 1,000 barrels of oil at $60 per barrel, representing $60,000 in notional value with approximately $4,500 in margin, creating leverage of roughly 13-to-1. While this leverage allows traders to control large positions with relatively modest capital outlays, it simultaneously means that adverse price movements can generate losses that exceed initial investments. Lower margin requirements for spreads enable more efficient capital deployment, but traders must resist the temptation to over-leverage their accounts simply because margin credits make larger positions accessible.
Correlation risks in spread trading
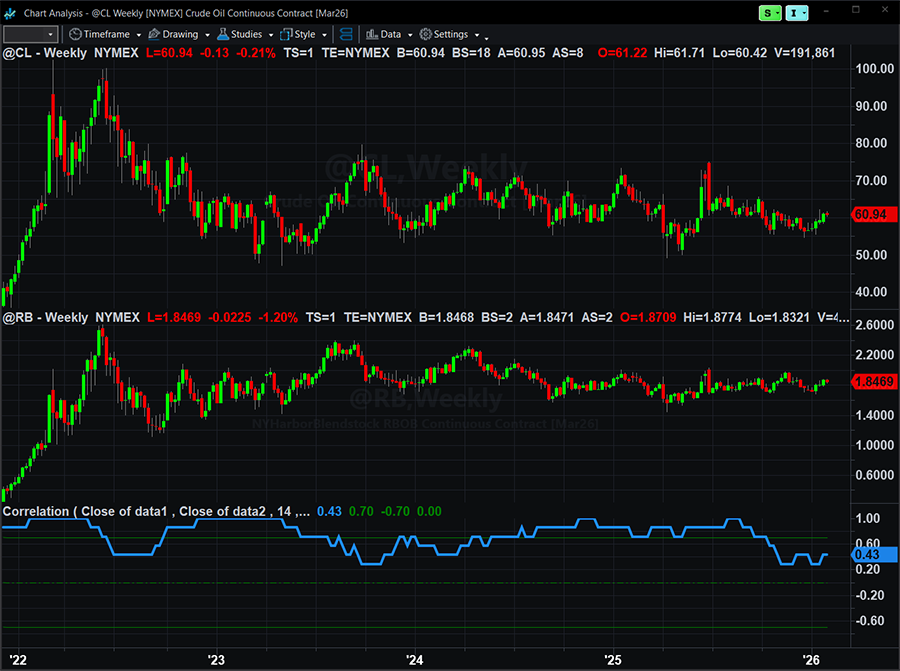
A common and dangerous misconception about spread trading is assuming that related commodities will always move in tandem. While crude oil and refined products exhibit a historical correlation of approximately 89%, that figure remains meaningfully below 100%. During periods of market stress or supply disruptions, these correlations can break down entirely, resulting in substantial losses for traders who assumed stable relationships.
The COVID-19 pandemic provided a dramatic example of extreme market dislocations. In April 2020, front-month WTI crude oil futures briefly traded at negative prices as storage facilities reached capacity and demand collapsed. Sellers were effectively paying buyers to take oil off their hands to avoid taking physical delivery and the associated storage costs, forcing them to sell at any price, even negative ones, to unload contracts before expiration. During that same period, gasoline and heating oil continued trading at positive prices, creating unprecedented dislocations in crack spreads that devastated traders positioned for normal relationships. More recently, in late 2025, diesel crack spreads surged more than 113 percent within weeks due to supply chain disruptions, demonstrating that even well-established patterns can experience extreme deviations.
Correlation risk extends beyond price direction. Even when crude oil and products move in the same direction, the magnitude of their price changes can differ significantly. A crude oil rally of $5 per barrel might coincide with a gasoline rally of only $3 per barrel, causing crack spreads to narrow and generating losses for traders who expected stable or widening spreads. These differential movements can occur due to inventory fluctuations, refinery maintenance schedules, specification changes, or geopolitical events that affect crude supply but not product demand.
Liquidity and execution considerations
Successful spread trading requires adequate liquidity in all legs of the position. WTI crude oil ranks among the most actively traded futures contracts globally, providing excellent liquidity during most market conditions. RBOB gasoline and heating oil futures also offer deep markets during regular U.S. trading hours, typically from 6:00 PM Sunday through 5:00 PM Friday Eastern Time, with a one-hour break each day from 5:00 PM to 6:00 PM.
However, liquidity can diminish during overnight sessions, holidays, or periods surrounding major economic releases. Traders should monitor bid-ask spreads before entering positions, as wider spreads indicate reduced liquidity and higher transaction costs. During volatile market conditions, bid-ask spreads may widen substantially, making execution at favorable prices more challenging.
Execution risk poses challenges when trading multi-leg spreads. If traders enter each leg individually—a practice called “legging in”—they face the risk of being filled on one leg while market prices move adversely before the other legs execute. This can transform an intended spread trade into an unhedged outright position, dramatically increasing risk exposure. TradeStation’s FuturesPlus platform addresses this concern through spread order functionality that treats multi-leg positions as single transactions, reducing leg risk by ensuring all components execute together or not at all.
Exchange-listed spread products offer another solution for execution risk. These products trade as single instruments with unified pricing, eliminating the need to manage multiple individual contracts. However, exchange-listed spreads may have lower trading volumes than their component legs, potentially resulting in wider bid-ask spreads that increase transaction costs.
Position sizing and risk management
Proper position sizing represents the foundation of sustainable trading success. Overleveraging accounts—even with positions that have sound fundamental or technical rationale—creates the risk of catastrophic losses that end trading careers. A widely accepted guideline suggests risking no more than one to two percent of total trading capital on any single trade.
Consider a trader with a $100,000 account who decides to risk two percent, or $2,000, on a crack spread trade. If the trader’s stop-loss level sits $4 per barrel away from the entry price, and the 3:2:1 crack spread position controls 6,000 barrels total (3,000 barrels of crude oil, 2,000 barrels of gasoline, and 1,000 barrels of heating oil, adjusted for notional value), a $4 adverse move would generate a $12,000 loss. This position size clearly violates the two-percent risk rule. The trader would need to either reduce position size, tighten the stop-loss distance, or allocate more capital to the account to make this trade appropriate for the stated risk tolerance.
Risk per trade calculation
|
3:2:1 Crack spread stop risk
|
Position sizing becomes more complex with spread trades because the dollar value of a one-point move depends on the ratio of contracts held and their respective contract specifications. Crude oil contracts have a multiplier of 1,000 (1,000 barrels), while gasoline and heating oil contracts have a multiplier of 42,000 (42,000 gallons, equivalent to 1,000 barrels). Traders must account for these differences when calculating potential profit and loss scenarios and determining appropriate position sizes for their capital base.
Setting effective stop-loss orders
Stop-loss orders are essential risk management tools, but they function differently in spread trading than in outright positions. Rather than triggering when crude oil reaches a specific price level, spread stops trigger when the differential between crude and products moves beyond a predetermined threshold.
Several methodologies exist for setting spread stops. One approach involves using a multiple of the average daily range of the spread itself. If the 3:2:1 crack spread typically moves $3 per barrel daily, a trader might set an initial stop at 1.5 to 2 times this range, or $4.50 to $6.00, from the entry level. This approach adapts to the volatility characteristics of the specific spread being traded.
Another approach relies on historical support and resistance levels identified through chart analysis of the spread. If the 3:2:1 crack spread has consistently found buying support near $20 per barrel over the past several months, a trader who enters a long crack spread position at $24 might set a stop below this support level, perhaps at $18, providing a cushion for normal volatility while exiting if the spread breaks below established technical levels.
Regardless of the methodology selected, traders must understand a critical limitation of stop-loss orders: they do not guarantee execution at the specified price. In fast-moving markets, stops may trigger but execute at significantly worse prices than intended, a phenomenon known as slippage. Gap openings after weekends or major news events can cause particularly severe slippage, with execution prices far from stop levels. This makes conservative position sizing even more important, as actual losses may exceed the risk parameters implied by stop-loss placement.
Entry and exit strategies
Successful crack spread trading combines both technical and fundamental analysis to identify favorable entry points and manage positions through to exit.
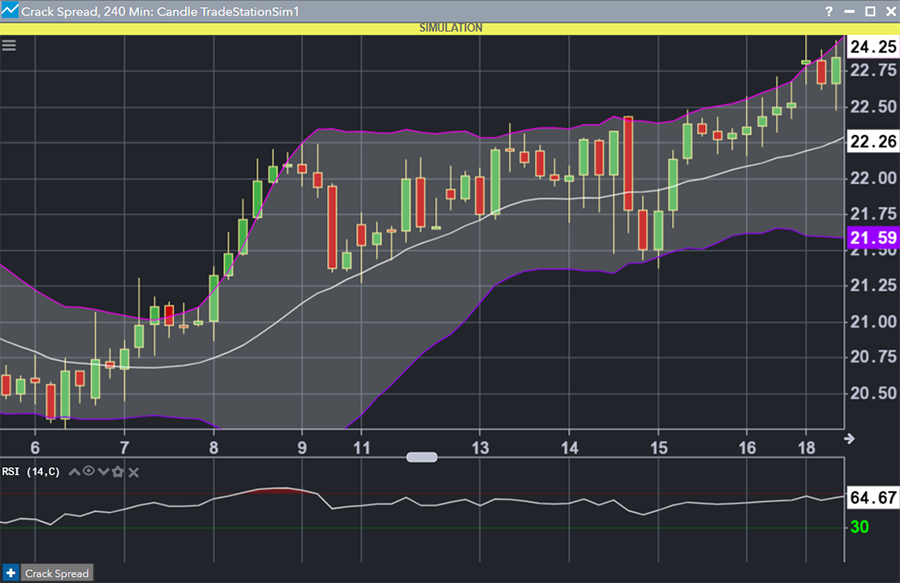
From a technical perspective, traders can apply traditional chart analysis tools directly to spread charts within the FuturesPlus platform. Moving averages may identify trends in the spread differential, while oscillators like the Relative Strength Index can signal overbought or oversold conditions. Bollinger Bands can highlight when spreads have deviated significantly from their recent average, potentially creating mean-reversion opportunities. Some traders look for spreads that have reached historical extremes relative to multi-year ranges, viewing these as potential turning points.
Fundamental analysis focuses on supply and demand factors that influence refining margins. The Energy Information Administration releases weekly petroleum inventory reports every Wednesday at 10:30 AM Eastern Time. These reports provide data on crude oil stocks, gasoline inventories, distillate inventories, and refinery utilization rates. A larger-than-expected draw in gasoline inventories typically supports wider gasoline crack spreads by indicating stronger demand or reduced supply. Conversely, builds in product inventories may pressure crack spreads by suggesting adequate or excess supply.
Refinery utilization rates significantly impact crack spreads. Lower utilization means refineries are producing fewer products, which can tighten supply and support wider spreads. Scheduled maintenance periods, which typically occur in spring and fall, can create seasonal patterns in crack spreads as reduced refining capacity temporarily constrains product supply.
Seasonal patterns offer another framework for timing entries and exits. Gasoline crack spreads typically begin strengthening in late February or early March as refiners transition from winter-grade to summer-grade gasoline production. Federal regulations require summer-grade gasoline to have lower Reid Vapor Pressure, which makes it more expensive to produce and could support wider crack spreads. This seasonal tendency often peaks in summer as driving activity reaches its annual high. Conversely, heating oil crack spreads typically strengthen from September through February as heating demand in the Northern Hemisphere increases.
Many traders combine technical and fundamental factors. For example, a trader might wait for fundamental developments, such as declining product inventories, to support a directional view, then use technical analysis to time the entry when the spread reaches a support level or forms a bullish chart pattern.
Exit strategies vary based on trading timeframe and objectives. Short-term traders might use trailing stops to capture trending moves while protecting accumulated profits. Longer-term traders might target the opposite seasonal extremes, such as entering long gasoline crack spreads in March and exiting in July or August. Others set profit targets at historical resistance levels identified through multi-year chart analysis. Regardless of the exit methodology, having a predefined plan helps traders avoid emotional decision-making during periods of market stress.
The Importance of Simulated Trading
Before committing real capital to crack spread trading, spending significant time in TradeStation FuturesPlus’s simulated trading mode provides invaluable experience without financial risk. The simulator allows traders to test their understanding of spread mechanics, practice calculating position sizes based on risk parameters, and develop proficiency with the platform’s order entry system.
Simulated trading also enables traders to observe how crack spreads behave across different market conditions. By paper trading across various environments—trending markets, range-bound periods, high-volatility events, and seasonal transitions—traders can develop intuition about spread behavior that complements their theoretical knowledge. This experience helps prepare traders for the emotional challenges of live trading, including managing positions during adverse moves and making exit decisions when plans must change.
Many professional traders recommend spending at least several weeks to several months in simulated trading before transitioning to live markets. This period allows traders to refine their strategies, identify weaknesses in their approach, and build genuine confidence in their abilities. The temporary delay in transitioning to live trading is insignificant compared to the protection it provides against costly early mistakes that could jeopardize trading capital.
Conclusion
Crack spreads provide traders with a specialized approach to energy markets, allowing them to express views on refining margins rather than absolute crude oil prices. The margin efficiency of spread positions, combined with potentially lower volatility than outright crude oil trades and recognizable seasonal patterns, makes crack spreads attractive to many futures traders.
However, these potential advantages come with commensurate risks. Leverage can magnify losses as readily as gains, correlation assumptions can fail during market stress, and execution challenges in multi-leg strategies require careful attention. Success in crack spread trading demands thorough preparation, disciplined risk management, and realistic expectations about both the opportunities and limitations of these strategies.
For traders interested in exploring crack spreads, beginning with comprehensive education and extensive simulated trading provides the strongest foundation. Use TradeStation FuturesPlus’s trade simulator to practice strategy implementation, develop platform proficiency, and build genuine confidence before risking real capital. Only after achieving consistent results in simulated trading and thoroughly understanding the risks involved should traders consider transitioning to live crack spread positions. With the right preparation and disciplined execution, crack spreads can become a powerful addition to a trader’s energy market toolkit.
Important Information and Disclosures
This content is for educational and informational purposes only. Any symbols, financial instruments, or trading strategies discussed are for demonstration purposes only and are not research or recommendations. TradeStation
companies do not provide legal, tax, or investment advice.
Past performance, whether actual or indicated by historical tests of strategies, is no guarantee of future performance or success. There is a possibility that you may sustain a loss equal to or greater than your entire investment regardless of which asset class you trade (equities, options or futures); therefore, you should not invest or risk money that you cannot afford to lose. Before trading any asset class, first read the relevant risk disclosure statements on www.TradeStation.com/Important-Information.
Securities and futures trading is offered to self-directed customers by TradeStation Securities, Inc., a brokerdealer registered with the Securities and Exchange Commission and a futures commission merchant licensed with the Commodity Futures Trading Commission. TradeStation Securities is a member of the Financial Industry Regulatory Authority, the National Futures Association, and a number of exchanges.
TradeStation Securities, Inc. and TradeStation Technologies, Inc. are each wholly-owned subsidiaries of TradeStation Group, Inc., both operating, and providing products and services, under the TradeStation brand and trademark. When applying for, or purchasing, accounts, subscriptions, products, and services, it is important that you know which company you will be dealing with. Visit www.TradeStation.com/DisclosureTSCompanies for further important information explaining what this means.
Margin trading involves risks, and it is important that you fully understand those risks before trading on margin. The Margin Disclosure Statement outlines many of those risks, including that you can lose more funds than you deposit in your margin account; your brokerage firm can force the sale of securities in your account; your brokerage firm can sell your securities without contacting you; and you are not entitled to an extension of time on a margin call. Review the Margin Disclosure Statement at www.TradeStation.com/DisclosureMargin.
Any examples or illustrations provided are hypothetical in nature and do not reflect results actually achieved and do not account for fees, expenses, or other important considerations. These types of examples are provided to illustrate mathematical principles and not meant to predict or project the performance of a specific investment or investment strategy. Accordingly, this information should not be relied upon when making an investment decision.
Futures trading is not suitable for all investors. To obtain a copy of the futures risk disclosure statement visit www.TradeStation.com/DisclosureFutures.
ID5368090 D0426