Futures Education Center
Trading the NOB Spread – U.S. Treasury Futures Spreads
The Notes over Bonds spread, commonly called the NOB spread, lets you trade the relative value between two Treasury futures contracts without relying on directional interest rate movement. This approach offers meaningful advantages—lower margin requirements and reduced directional exposure—but also introduces unique risks that require careful understanding.
Treasury futures spreads have become essential tools for traders who want to express views on how different parts of the yield curve will move relative to one another. Instead of predicting whether all interest rates will rise or fall, a treasury spread trader profits when the price gap between two related contracts widens or narrows. This fundamental difference shapes everything from position sizing to risk management.
The building blocks: Treasury futures fundamentals
Before diving into treasury spreads, you need to understand the building blocks. Treasury futures are standardized contracts that derive their value from U.S. government debt securities. Understanding these contract specifications is essential because the NOB spread relies on how each contract responds differently to changes in interest rates.
The two key futures contracts involved in the NOB spread are:
10-Year Treasury Note futures
|
30-Year Treasury Bond futures
|
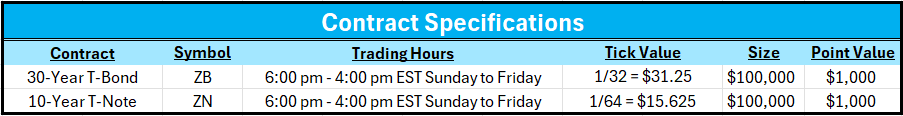
Both contracts trade nearly around the clock, Sunday evening through Friday afternoon, and settle quarterly in March, June, September, and December. This standardization makes them ideal for spread trading because you can easily enter and exit positions in highly liquid markets.
The NOB spread explained
The NOB spread expresses a view on the relative performance of the 10‑year and 30‑year points on the Treasury yield curve. You simultaneously buy one and sell the other, creating a position that profits when the price gap between them changes, regardless of whether both prices are rising or falling together.
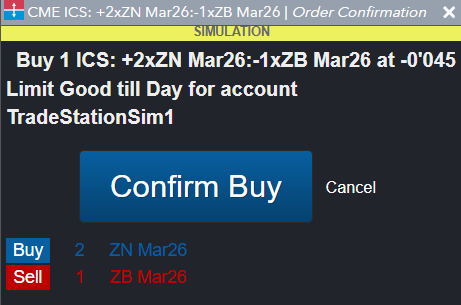
Buying the NOB means going long 10-year note futures while shorting 30-year bond futures. This position profits when 10-year notes outperform 30-year bonds, which typically happens when long-term interest rates rise faster than intermediate-term rates. Traders call this a “steepening” trade because it anticipates that the yield curve will steepen.
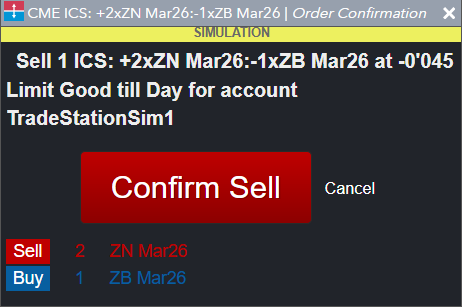
Selling the NOB is the opposite: shorting 10-year notes while buying 30-year bonds. This spread profits when long-term bonds outperform, usually occurring when the yield curve “flattens” as long-term rates fall relative to shorter-term rates.
Buying the NOB
 |
Selling the NOB
 |
Because bond prices move in the opposite direction of their yield, rising interest rates cause futures prices to fall, and falling rates cause them to rise. This inverse relationship explains why steepening and flattening environments affect the NOB spread the way they do.
The standard NOB spread uses a 2:1 ratio—two 10-year contracts for every one 30-year contract. This ratio exists because 30-year bonds are more sensitive to interest rate changes due to their longer duration. The 2:1 ratio approximately equalizes the dollar sensitivity of each leg, making the spread close to “duration-neutral.” When structured this way, parallel shifts in the entire yield curve have minimal impact on your profit or loss. You make or lose money only when the two legs move differently from each other.
Why traders choose spreads over outright positions
Trading Treasury spreads rather than single futures contracts offers several practical benefits that make them attractive to many market participants.
Reduced directional risk tops the list. When you hold an outright long position in Treasury bond futures, you lose money if interest rates rise even slightly. With a properly constructed NOB spread, a general rise in rates affects both legs similarly—your loss on one leg is largely offset by gains on the other. Your profit comes only from changes in the relationship between the two maturities, not from guessing where rates are headed overall.
Lower margin requirements provide capital efficiency—typically 70-80% lower than outright positions—which we’ll explore in detail in the margin section below. This efficiency lets you maintain positions with less capital tied up, though it also introduces temptations around leverage that demand strict discipline.
More predictable behavior makes spreads easier to analyze for some traders. While outright Treasury futures can move sharply on any economic report or Federal Reserve comment, spreads tend to be more stable day to day. The correlation between the two legs dampens volatility. Historical spread ranges are often more consistent than outright price ranges, potentially making technical analysis more reliable.
This stability, combined with lower directional exposure and capital efficiency, explains why spreads are a cornerstone strategy for many Treasury traders.
How margin requirements work for spreads
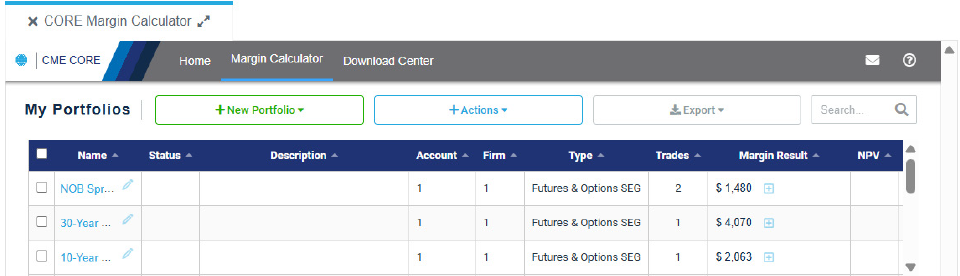
Understanding how margin works for Treasury spread positions is essential for proper risk management. The CME’s SPAN (Standard Portfolio Analysis of Risk) system automatically identifies offsetting positions and calculates reduced margin requirements accordingly. SPAN recognizes that the legs of a spread offset much of each other’s market risk.
For outright positions, you must post initial margin to open a position and maintain a separate maintenance margin to keep it open. If your account falls below maintenance, you’ll receive a margin call requiring you to deposit additional funds. Current initial margins for 10-year note futures are roughly $2,000 per contract, while 30-year bonds require about $4,000.
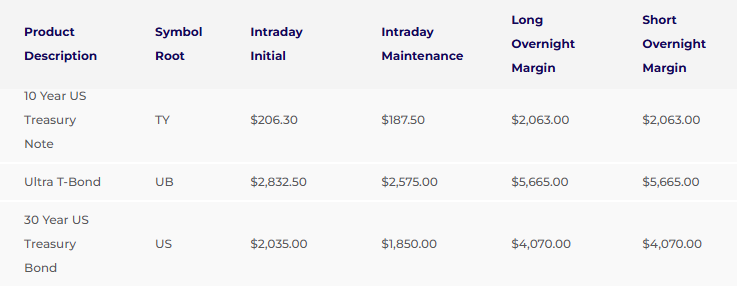
When you enter a recognized spread, the exchange calculates both legs together and applies an inter-commodity spread credit of more than 80%. Suppose your combined outright margin totals about $8,200; an 80% credit reduces your actual requirement to $1,640. This dramatic reduction reflects genuinely lower risk—but it creates a dangerous illusion. Just because you can control more contracts doesn’t mean you should. Lower margin requirements do not equal lower risk in absolute terms; they reflect lower risk per dollar of exposure. Traders who use their freed-up capital to increase position size dramatically are often courting disaster.
Risk factors every spread trader must understand
While spreads reduce certain risks compared to outright positions, they introduce their own challenges that require careful attention.
Correlation risk is the fundamental danger. The entire premise of spread trading assumes the two legs will continue to move in a correlated fashion. When correlation holds, parallel rate movements cancel out, leaving you exposed only to changes in the relationship. But correlations can break down, especially during market stress. During the March 2020 Treasury market disruption, normally well-behaved relationships experienced severe dislocations as liquidity evaporated. Traders who assumed their spreads were “safe” sometimes faced losses on both legs simultaneously.
Basis risk arises from the complex mechanics of Treasury futures. Each contract has multiple bonds or notes that qualify for delivery, and the futures price tracks whichever deliverable security is “cheapest to deliver.” When market conditions shift—particularly when yields move significantly—the cheapest-to-deliver security can change, altering the futures contract’s behavior. This can cause unexpected moves in your spread even when the underlying yield relationship hasn’t changed much.
Execution risk (also called “leg risk”) occurs when entering or exiting positions. If you try to trade each leg separately, you might get filled on one side while the other moves away from you, leaving you with unintended directional exposure. Modern trading platforms address this through dedicated spread order types that execute both legs simultaneously at a specified price differential. Never attempt to “leg into” a spread by trading each side separately—always use spread orders.
Liquidity risk matters even in normally liquid markets. Treasury futures are among the most actively traded contracts globally, with millions of contracts changing hands daily. However, during volatile periods, bid-ask spreads can widen dramatically, and order-book depth can collapse. This makes entering and exiting positions more costly and may force you to accept worse-than-expected prices.
Recognizing and preparing for these risks is essential to successfully trading Treasury spreads.
Position sizing and leverage management
The reduced margin requirements for spreads create a seductive trap: the ability to take on enormous positions relative to your account size. This temptation destroys more spread trading accounts than almost any other factor.
Consider the math: a 2:1 NOB spread controls roughly $300,000 in notional value. With about $1,640 in margin, you’re controlling over 180 times your deposit. A $50,000 account could theoretically hold 30 spreads—controlling $9 million in exposure. This would be reckless. When correlation breaks down, losses occur on $9 million worth of positions, not on the $50,000 account balance. A modest percentage move can wipe out an over-leveraged account in hours.
Conservative position sizing starts with total notional exposure. A reasonable guideline limits your combined notional exposure across all positions to three to five times your account balance. For a $50,000 account, that implies a total notional of $150,000- $250,000—perhaps one or two NOB spreads at most.
Another position sizing approach focuses on the dollar amount you’re willing to risk per trade. If you’re comfortable risking 2% of your account on a single spread trade, that’s $1,000 on a $50,000 account. Calculate how far the spread might move against you before hitting your stop-loss, then size the position so that movement equals your risk tolerance. If historical volatility suggests the spread might move $400 against you before reaching a logical stop point, you could trade two spreads (2 × $400 = $800 risk) while staying within your $1,000 limit.
Start smaller than you think necessary. When learning a new strategy, trading a minimum position size helps you build experience without risking your account. For NOB spreads, this means one spread: two 10-year contracts and one 30-year contract. Only after demonstrating consistent profitability should you consider increasing size.
Maintain substantial margin buffers. Even though exchange minimums might allow you to hold a position with exactly the required margin, operating this way is dangerous. During volatile markets, exchanges routinely increase margin requirements—sometimes doubling them overnight, as happened in March 2020. If you’re already near minimum margin when requirements jump, you’ll face immediate liquidation at the worst possible prices. Keeping three to four times the minimum margin available provides breathing room.
Scale positions during high-volatility periods. When implied volatility rises or markets become stressed, reduce position size accordingly, rather than widening stops and accepting larger potential losses, trade smaller.
Setting entry points
Identifying attractive entry points for NOB spreads requires combining fundamental yield-curve analysis with technical chart analysis.
Fundamental factors driving the NOB spread include Federal Reserve policy, inflation expectations, and economic growth projections. The spread typically steepens (favoring buying the NOB) when traders expect inflation to persist or when the Fed begins raising short-term rates, since long-term bonds are more sensitive to inflation. The spread typically flattens (favoring selling the NOB) during economic slowdowns or when the Fed signals an extended easing of policy, as investors seek the safety and yield of long-term bonds.
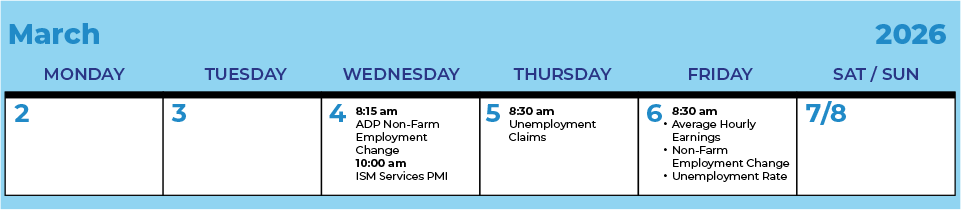
Economic events that often trigger NOB spread moves include Federal Open Market Committee meetings, employment reports, inflation data releases, and Treasury auction results. Developing a view on these fundamentals helps identify directional bias.
Technical analysis applies to the spread itself, not to individual leg prices. Many traders chart the spread differential directly and apply standard technical tools—trendlines, support and resistance levels, moving averages, and momentum indicators. Because spreads often exhibit mean-reverting behavior, reaching the extremes of historical ranges can signal opportunity.
Using fundamentals and technicals together often produces more reliable entry signals than relying on either one alone.
Exit strategies and stop-loss management
Setting appropriate exit points requires balancing the desire to capture profits against the discipline to let favorable trades develop fully.
Target levels often derive from historical spread ranges. If a spread historically oscillates between +2 points and -1 point, entering near one extreme with a target near the opposite extreme provides a framework. Risk-reward ratios of two-to-one or three-to-one help ensure that winning trades compensate for inevitable losers. If you’re risking $500 per spread on a trade, targeting at least $1,000 in profit maintains positive expectancy even with a win rate below 50%.
Event-driven exits recognize that economic reports and Fed announcements often resolve the uncertainty that created your trade thesis. If you entered a steepening trade expecting a hawkish Fed meeting, the meeting itself becomes a natural exit point regardless of whether your target has been reached.
Time-based exits acknowledge that your thesis may be wrong at times. If a spread hasn’t moved in your favor within your expected timeframe, exiting at a slight loss or breakeven preserves capital for better opportunities. Spreads that work often begin moving favorably almost immediately; those that languish for extended periods are usually telling you something important.
Exits are only half of the equation; managing downside risk is equally important.
Managing Stop-Losses for Spreads
Managing downside risk through stop-losses is more complex for spreads than for single-contract positions, and each method involves tradeoffs.
Spread-differential stops trigger when the spread moves against you by a predetermined amount. You monitor the spread value and exit both legs together when it hits your threshold, maintaining the spread structure and preventing the disaster of being stopped out of one leg while the other continues against you. Set stop distance using historical spread volatility—typically two times the 20-day average daily range. This prevents stops from being triggered by normal fluctuations while limiting losses from genuine adverse moves.
Technical-level stops place exits at significant support or resistance levels on the spread chart itself. If you’re long the NOB and the spread breaks below a key support level, exiting acknowledges that your trade premise is no longer valid.
Percentage-of-margin stops cap losses at a fixed percentage of initial margin—typically 15-20% per trade. This method provides discipline for position sizing and keeps it aligned with your account capacity.
Critical warning: Never set stop losses on individual legs of a spread position. If one leg gets stopped while the other remains open, you’ve instantly converted your spread into an outright directional position—exactly the concentrated risk you were trying to avoid.
Some experienced spread traders forego traditional stops entirely, instead trading smaller sizes and allowing positions to fluctuate more. For mean-reverting strategies, like many spread trades, tight stops can harm overall performance by prematurely cutting off positions that would have recovered. This approach requires genuine discipline around position sizing and honest self-assessment about whether you can tolerate larger interim fluctuations.
Choosing the right exit strategy—and applying it consistently—can matter as much as choosing the correct entry.
Execution best practices
Even in highly liquid Treasury futures markets, execution quality matters for the profitability of spread trading.
Always use dedicated spread order types rather than trading each leg separately. Trading platforms like TradeStation FuturesPlus offer spread order functionality that ensures both legs execute simultaneously at your specified spread differential, eliminating execution risk.
Limit orders protect you in fast-moving markets by specifying the exact spread differential you’ll accept. Market orders guarantee execution but not price—acceptable for small positions in calm markets but risky when volatility spikes.
Time your executions thoughtfully. Liquidity is deepest during regular trading hours, roughly 8:00 AM to 3:00 PM Eastern time. Overnight sessions can have significantly wider bid-ask spreads and thinner order books. For larger positions, especially, executing during peak liquidity hours reduces costs.
Monitor both legs individually, even when trading the spread. Unusual behavior in one leg—perhaps due to approaching delivery, a cheapest-to-deliver switch, or supply-demand imbalances—can signal changing conditions that affect your spread.
Consistently applying these practices helps minimize avoidable slippage and execution related risk.
Using TradeStation FuturesPlus for spread trading
TradeStation FuturesPlus provides purpose-built tools for analyzing, placing, and monitoring futures spread trades, helping you manage both execution and risk more effectively.
The platform’s matrix grid view lets you visualize spread relationships across multiple contracts simultaneously, making it easier to identify relative value opportunities. You can build custom spreads and monitor their behavior in real time alongside individual legs.
For order entry, FuturesPlus supports dedicated spread order types that execute both legs simultaneously at your specified differential. The platform also offers a Request for Quote (RFQ) system for spreads, allowing you to request prices directly from exchange market makers. Combined with the MD Trader ladder and click-to-trade functionality, you have multiple efficient entry methods.
Real-time position monitoring shows both your spread positions and individual leg exposure, with risk metrics updating continuously. Account margin status helps you stay aware of your cushion above minimum requirements.
The simulated trading mode deserves special emphasis. FuturesPlus lets you switch seamlessly between live and simulated accounts directly within the platform. In simulation mode, you can practice building spreads, entering orders, and managing positions with all the same tools you’d use in live trading—but without risking real money. This capability is invaluable for developing comfort with spread-order mechanics, testing position-sizing approaches, and building confidence. Spend substantial time in simulated mode before committing real capital. The mechanics of spread trading differ enough from single-contract trading that practice time pays dividends in the form of avoided mistakes.
Building competence takes time and practice
Treasury futures spreads, such as the NOB, offer genuine advantages: reduced directional risk, lower margin requirements, and the ability to express precise views on yield curve relationships. But these benefits come with their own complexities around correlation risk, basis dynamics, and execution challenges.
Success requires understanding these nuances. The reduced margins that make spreads capital-efficient can also tempt traders into over-leveraging—the most common path to account destruction. Thoughtful position sizing, appropriate stop-loss strategies, and constant attention to changing market conditions separate successful spread traders from those who blow up.
Begin by studying the fundamental and technical factors that drive the NOB spread. Develop a clear thesis about why you expect the spread to widen or narrow. Practical experience matters as much as theoretical understanding. Use simulated trading mode extensively to practice order entry and position management until the mechanics feel natural. Start with a minimum position size when you transition to live trading, increasing only after demonstrating consistent profitability. Like all professional trading disciplines, mastery comes from repetition, reflection, and consistent risk control.
Important Information and Disclosures
Futures trading is not suitable for all investors. To obtain a copy of the futures risk disclosure statement visit www.TradeStation.com/DisclosureFutures.
Margin trading involves risks, and it is important that you fully understand those risks before trading on margin. The Margin Disclosure Statement outlines many of those risks, including that you can lose more funds than you deposit in your margin account; your brokerage firm can force the sale of securities in your account; your brokerage firm can sell your securities without contacting you; and you are not entitled to an extension of time on a margin call. Review the Margin Disclosure Statement at www.TradeStation.com/DisclosureMargin.
Any examples or illustrations provided are hypothetical in nature and do not reflect results actually achieved and do not account for fees, expenses, or other important considerations. These types of examples are provided to illustrate mathematical principles and not meant to predict or project the performance of a specific investment or investment strategy. Accordingly, this information should not be relied upon when making an investment decision.
This content is for educational and informational purposes only. Any symbols, financial instruments, or trading strategies discussed are for demonstration purposes only and are not research or recommendations. TradeStation companies do not provide legal, tax, or investment advice.
Past performance, whether actual or indicated by historical tests of strategies, is no guarantee of future performance or success. There is a possibility that you may sustain a loss equal to or greater than your entire investment regardless of which asset class you trade (equities, options or futures); therefore, you should not invest or risk money that you cannot afford to lose. Before trading any asset class, first read the relevant risk disclosure statements on www.TradeStation.com/Important-Information.
Securities and futures trading is offered to self-directed customers by TradeStation Securities, Inc., a brokerdealer registered with the Securities and Exchange Commission and a futures commission merchant licensed with the Commodity Futures Trading Commission. TradeStation Securities is a member of the Financial Industry Regulatory Authority, the National Futures Association, and a number of exchanges.
TradeStation Securities, Inc. and TradeStation Technologies, Inc. are each wholly-owned subsidiaries of TradeStation Group, Inc., both operating, and providing products and services, under the TradeStation brand and trademark. When applying for, or purchasing, accounts, subscriptions, products, and services, it is important that you know which company you will be dealing with. Visit www.TradeStation.com/DisclosureTSCompanies for further important information explaining what this means.
ID5302335 D0326