Using Fibonacci Retracements on TradeStation
Trading in TITAN X: Placing and Managing Trades
An overview of TradeStation TITAN X trading tools, including chart-based order entry, OCO functionality, and integrated risk management features.
Call toll-free 800.328.1267

Stock prices often zig and zag instead of moving in a straight line. Today we’ll explore Fibonacci retracements, a popular tool for navigating ups and downs in stock and futures markets.
The Fibonacci (“Fib”) tool is a drawing instrument on TradeStation’s charts that plot lines for potential pullbacks. It’s based on a series of numbers discovered by medieval mathematician Leonardo Fibonacci. While the calculations are complicated, their use in the market is relatively straightforward.
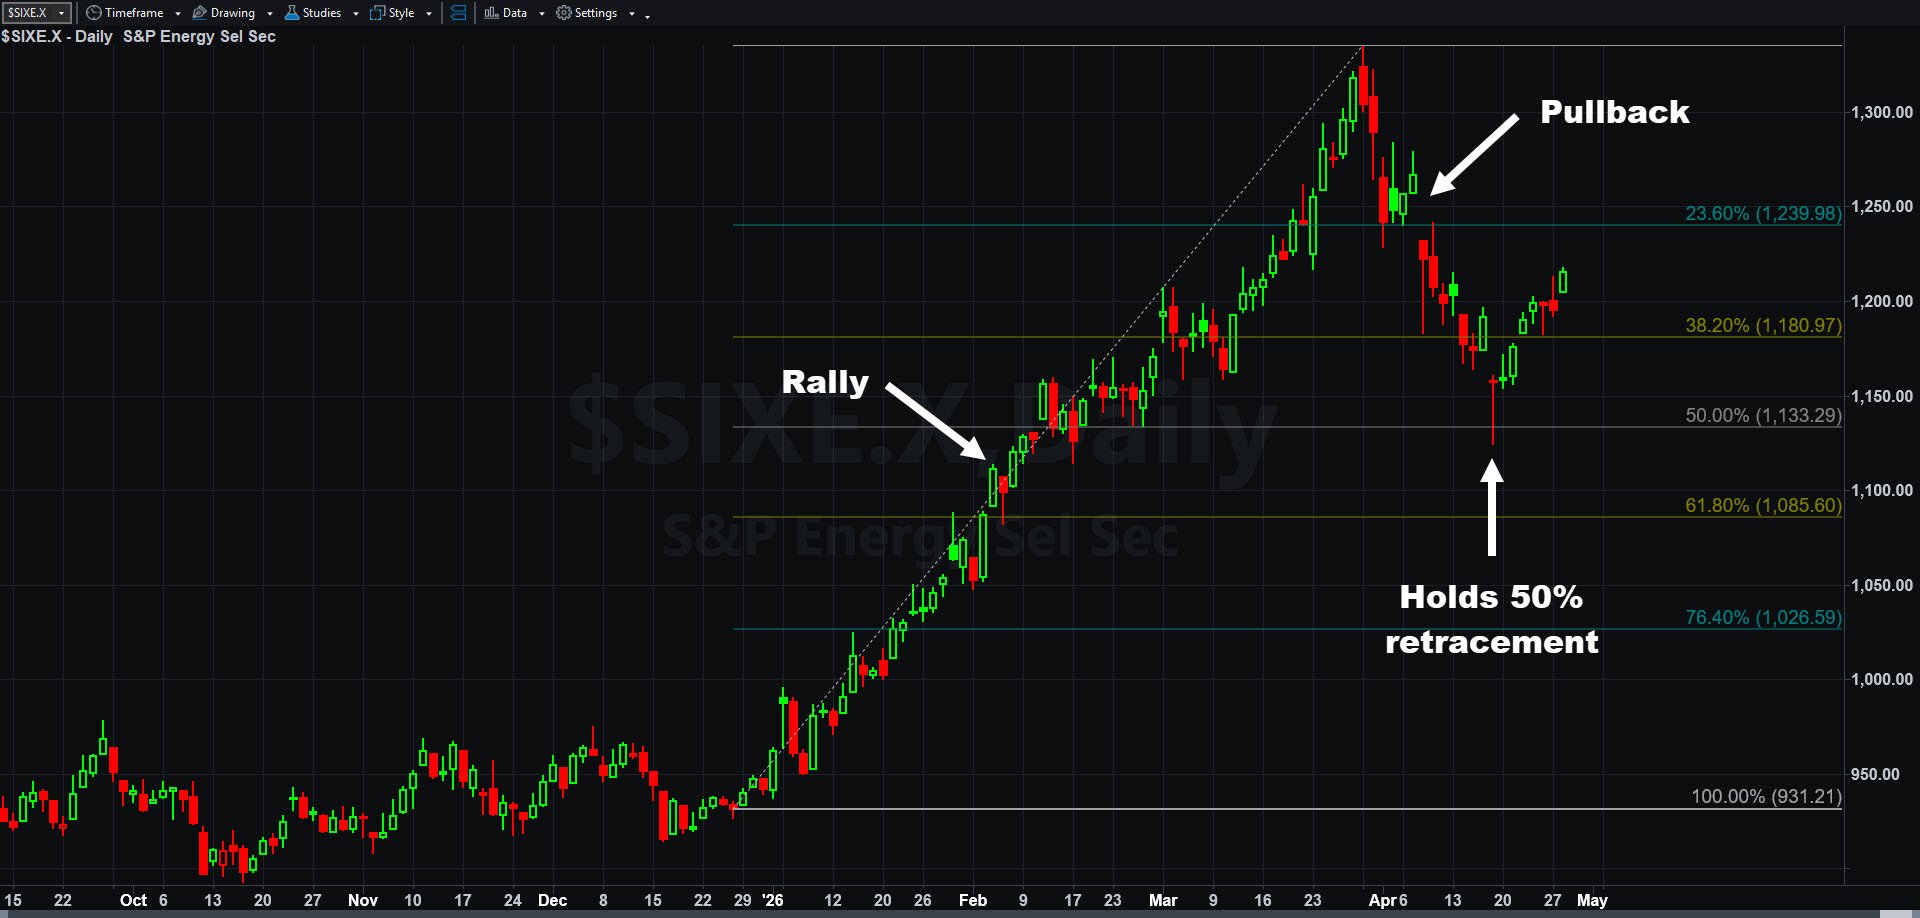
S&P Energy Select Index ($SIXE.X), daily chart, showing recent Fibonacci retracement.
Simply put, the Fibonacci trading looks for stocks to give back, or “retrace,” certain amounts of a move. They’re based on percentages of the advance or decline. The Fibonacci tool looks for retracements of:
Bullish traders can use these countertrend moves to identify pullbacks in an upward-trending stock they’d like to buy. Bearish Fibonacci traders can look for potential rebounds to sell.
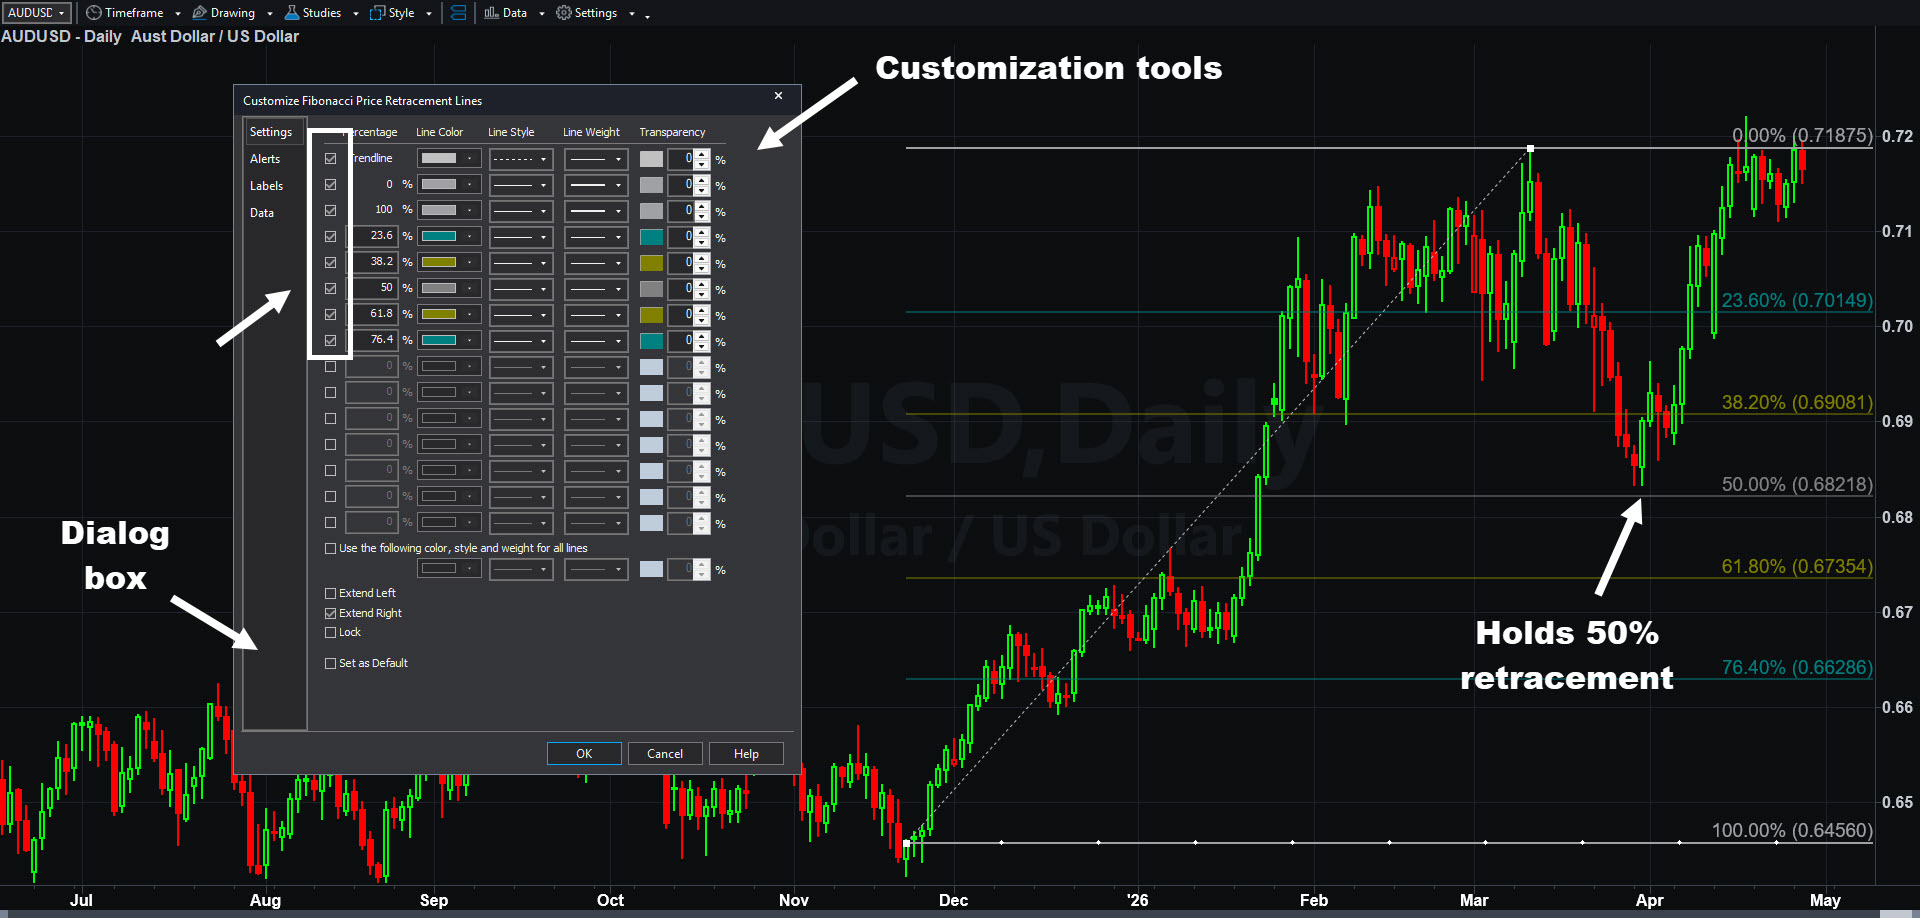
Australian dollar (AUDUSD), daily chart, showing recent Fibonacci retracement.
Traders can access Fib retracements on TradeStation’s platform by following these steps:
You can adjust the drawing by right clicking on a line and selecting “Edit ‘Fibonacci Retracement Lines.’”
A dialog box will appear. You can make some of the following changes:
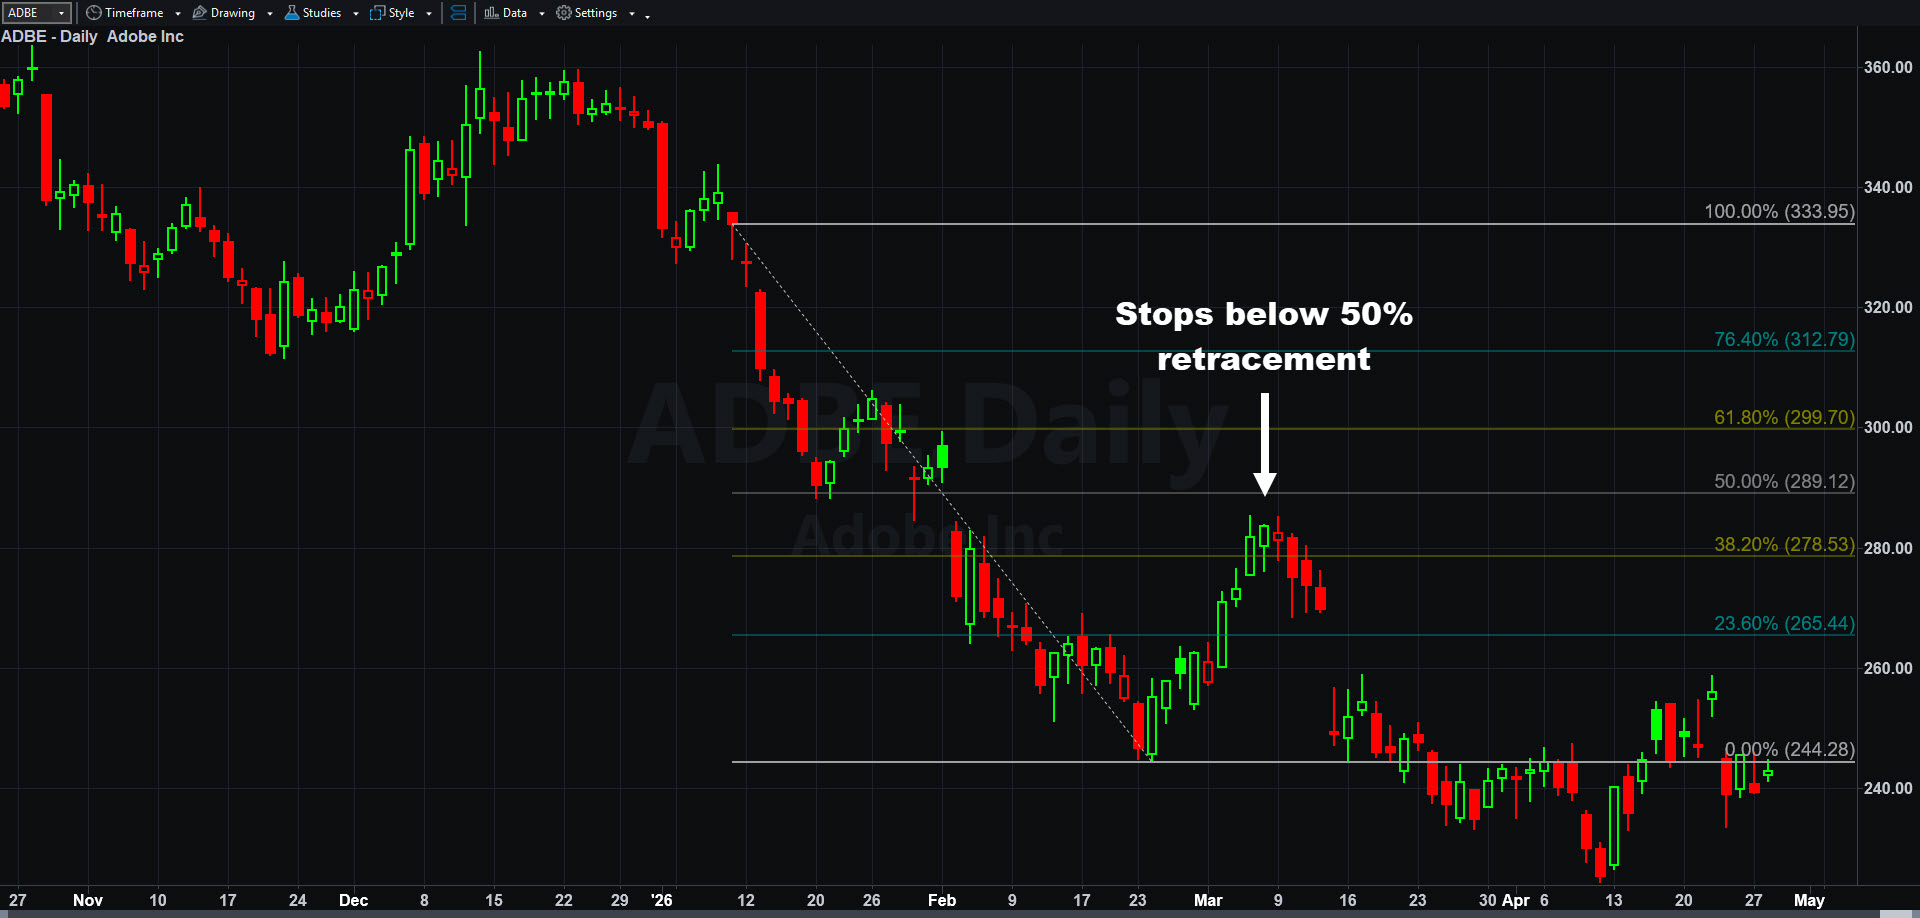
Adobe (ADBE), daily chart, showing bearish Fibonacci retracement in March.
Markets don’t always move in a straight line. Pullbacks and counter-trend fluctuations often occur, creating potential opportunities for directional traders. This can be true for bullish or bearish moves.
Take energy stocks, for example. The S&P Energy Select Sector Index ($SIXE.X) rallied to new all-time highs in February and March as tensions grew in the Middle East. It stalled as a ceasefire took hold and pulled back for three weeks. However it bounced at almost exactly a 50 percent retracement of its advance. That gave a potential signal that prices were still ascending.
Adobe (ADBE), on the other hand, has been in a downtrend. It broke support in late January and slid to a new xx-year low a month later. Prices rebounded for about two weeks but stalled below a 50 percent retracement of the downward move. The software company then proceeded to a new long-term low, illustrating how trend followers can potentially utilize retracement levels.
In conclusion, Fibonacci retracements can be a useful tool for active traders in the stock market. Hopefully this article helps get you started with this technical analysis method.
IMPORTANT: The projections or other information generated by Fibonacci Retracement lines regarding the likelihood of various investment outcomes are hypothetical in nature, do not reflect actual investment results and are not guarantees of future results.

An overview of TradeStation TITAN X trading tools, including chart-based order entry, OCO functionality, and integrated risk management features.

Discover how TradeStation’s TITAN X simplifies options trading with a fast, intuitive interface
built for strategy-focused traders. From analyzing setups to executing a bull call spread,
learn how to analyze risk, customize trades, and manage positions with precision.

Learn to use technical studies, customizable charting tools, and drawing features in TITAN X.