AI Hammered as Value Stocks Break Out

Call Volume Spikes: Has Oracle Bottomed?
Is Oracle finally bottoming? Some traders may think it has.
Call toll-free 800.328.1267

AI stocks are falling as negative headlines mount.
The S&P 500 slid 0.5 percent between Friday, December 5, and Friday, December 12. A more dramatic move occurred in the tech-heavy Nasdaq-100, which lost 2 percent of its value. The Nasdaq also had a bearish “outside week,” a potential reversal pattern.
Mixed quarterly results from Oracle (ORCL) and Broadcom (AVGO) triggered some of the selling. ORCL had its biggest weekly drop in seven years after cloud-computing and software revenues missed estimates. Worries continued to grow about its increased borrowing to build data centers. The company is down about 55 percent from its all-time high in September.
AVGO had two issues: margin pressures and a weaker-than-expected backlog. Those signs of slowing can weigh on growth companies that trade based on business 2-3 quarters into the future.
Another potential risk surfaced on Thursday when the Phoenix suburb of Chandler, Arizona, voted against a data-center project. Is political opposition growing before next year’s election cycle? Separately, Fermi (FRMI) dropped 33 percent after an expected tenant abandoned a project in Texas. FRMI went public in September to provide power to AI data centers. It’s lost more than half its value since then.
| Oracle (ORCL) | -13% |
| AutoZone (AZO) | -9.9% |
| SanDisk (SNDK) | -9.8% |
| Robinhood (HOOD) | -9.4% |
| Texas Pacific Land (TPL) | -9.3% |
| Source: TradeStation data |
The Federal Reserve also lowered interest rates by 25 basis points, but signaled only a single cut in 2026.
Chicago Fed President Austan Goolsbee, one of the two policymakers who opposed a cut, told CNBC he is “uncomfortable front-loading too many rate cuts.” He added that lower inflation in coming months may justify easier policy, but wanted to see more data. Beth Hammack of Cleveland, who joins the voting board next year, also favored “a slightly more restrictive stance.”
The central bank’s forward projections raised the estimate for economic growth from 1.8 percent to 2.3 percent. Core inflation was expected to stay above the 2 percent target, which could prompt policymakers to stay hawkish.
Most of the other economic headlines were unimportant. This week is more active, with payroll data, retail sales and inflation. (See below for more.)
Some traders may see potential signs of the AI trade stalling. For example, the Dow Jones Industrial Average rose 1 percent to a new high, outperforming the Nasdaq by 2.9 percentage points. It was the widest differential since late February.
TradeStation data also shows “value” stocks up 4 percent since the end of September. The “growth” bucket, which includes technology and AI companies, has only risen 0.4 percent. That represents a change in the trend over the last three years, when growth climbed 120 percent and value rose 40 percent.
Separately, Seeking Alpha reported that short sellers increased bearish positioning in tech stocks last month.
Chart watchers could additionally see risk in the Philadelphia Semiconductor Index, which failed to hold above a peak from October. That may be viewed as a false breakout or double-top. Either is a potential reversal pattern.
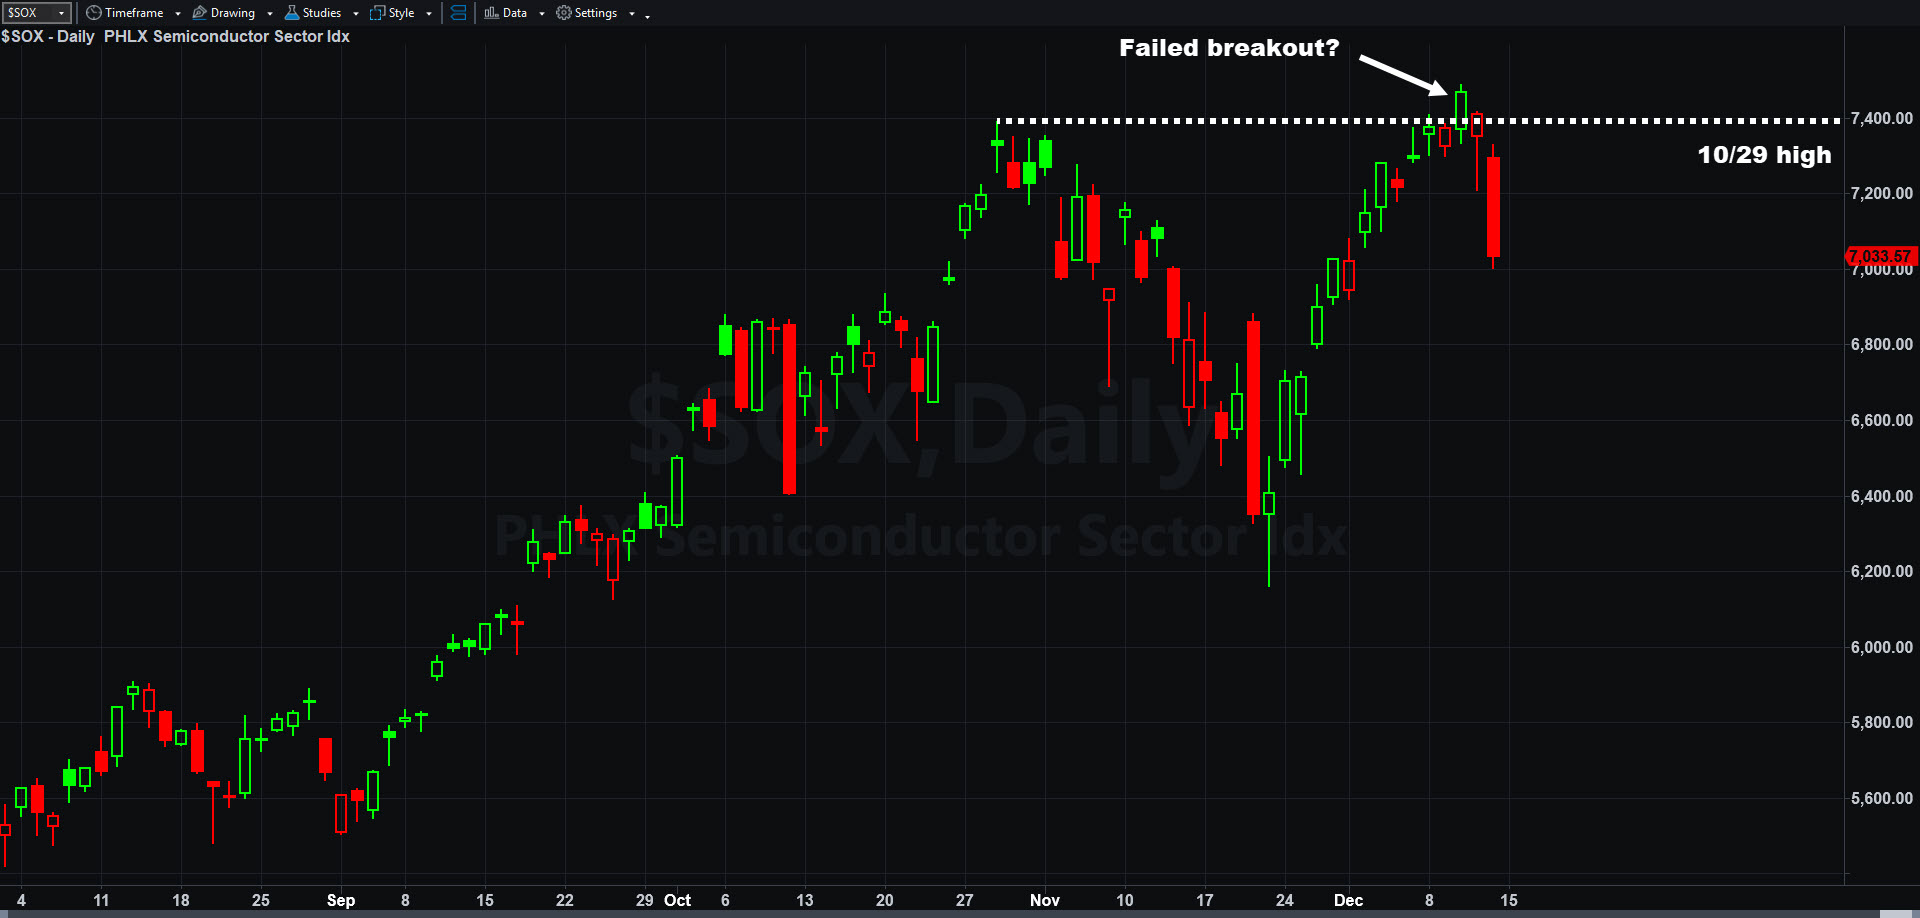
Philadelphia Semiconductor Index ($SOX), daily chart, with potential false breakout.
Despite those potential risks, several firms issued positive notes last week:
While sentiment was gloomy in technology, other parts of the market rallied.
Banks and financials climbed to new highs as investors shifted to value stocks. American International Group (AIG) led the advance after Insurance Insider reported it may be acquired by Chubb. Visa (V) was upgraded by Bank of America and Goldman Sachs (GS) said dealmaking will keep growing next year. Bank of America (BAC) also broke out to a new all-time high above its 2006 peak.
Industrial stocks, another member of the “value bucket,” also climbed to a new high.
| Warner Bros. Discovery (WBD) | +15% |
| Mosaic (MOS) | +11% |
| Molina Healthcare (MOH) | +11% |
| Norwegian Cruise Line (NCLH) | +10% |
| American International Group (AIG) | +10% |
| Source: TradeStation data |
The Russell 2000 hit a record following a bullish call by Morgan Stanley. Barron’s reported that the small-cap index will grow earnings by 35 percent in the next two years — more than twice the S&P 500’s pace.
Gold miners and silver spot prices also had their highest weekly closing prices ever.
Warner Bros. Discovery (WBD), the target of a bidding war between Netflix (NFLX) and Paramount Skydance (PSKY) had the biggest gain in the S&P 500.
Cannabis producers like Tilray (TLRY) and Canopy Growth (CGC) surged after The Washington Post reported that President Trump will ease restrictions on marijuana.
Materials, financials, industrials and consumer staples were the top performers overall last week. Technology, utilities and energy led to the downside.
Chart watchers may see mixed technical patterns on the S&P 500, which is stuck near old highs.
The index tested a price range from its record peak on October 29, only to close below. It also tried unsuccessfully to stay above 6,900. That rejection could potentially confirm resistance has been established.
Second, underperformance in major technology companies like AVGO and Nvidia (NVDA) could weigh on the broader market.
Third, last month’s dip below October’s trough broke a series of higher lows. The index could now be at risk of making a lower high. Combined with November’s lower low, that could represent a break of the longer-term trend.
Investors may also see potential risk in the 10-year Treasury yield, which ended last week near a three-month high around 4.20 percent. Further upside could potentially weigh on risk appetite.
Still, some measures of internals remain potentially bullish. For example, the advance/decline line hit a new high on Thursday. The number of index members making new 52-week highs also hit the highest level since March.
There are a few noteworthy downside levels. First is the psychologically important 6,800 level. Second is the 6,770-6,775 range, matching a handful of peaks in November. Below that, traders may eye the recent low of 6,522.

S&P 500, daily chart, with select patterns and indicators.
This week features some big economic reports and noteworthy earnings reports. It’s also the last full week of 2025.
Today’s items include speeches by Fed governor Stephen Miran and New York Fed President John Williams. NAHB’s homebuilder sentiment index is also due.
Tuesday brings the nonfarm payrolls report for November (delayed by the government shutdown) and retail sales. Housing starts and building permits are due at the same time. Homebuilder Lennar (LEN) announces quarterly results in the afternoon.
Wednesday features crude-oil inventories. Micron Technology (MU) reports earnings after the closing bell.
Thursday brings the consumer price index (CPI) for November and initial jobless claims. Nike (NKE) and FedEx (FDX) results are in the postmarket.
Existing home sales are on Friday.

Is Oracle finally bottoming? Some traders may think it has.

Nebius consolidated for months, but some traders may think the datacenter stock is breaking out. The first pattern on today’s chart is the long basing pattern between November and late March. (It could also be viewed as a cup and handle following the rally between...

Chipmakers are trying to break out as investors brace for a potential oil shock.