TradeStation Has Powerful Tools for Earnings Season

Analyzing Markets with Advanced Charting on TITAN X
Learn to use technical studies, customizable charting tools, and drawing features in TITAN X.
Call toll-free 800.328.1267

Quarterly earnings can be major events in the stock market, giving key information about companies and providing trading opportunities. This article will highlight some ways TradeStation can help customers before and after these reports.
Knowing the dates of results is key to planning. TradeStation makes this information easily available with RadarScreen™ and charts.
Here are the steps on RadarScreen:
Here are the steps to add earnings dates to charts:
TradeStation can display fundamental data on companies in several ways. The attached workspace includes the prebuilt tab “Fundamentals” with common indicators like the Price / Earnings ratio and EPS Growth.
Customers can access this resources by:
Some traders may want to avoid the volatility of earnings and enter positions after the news has passed. For example, stocks might rally on strong results and pull back in a week or two later.
RadarScreen can help in those scenarios as well various types of alerts. The included workspace features a few potential examples.
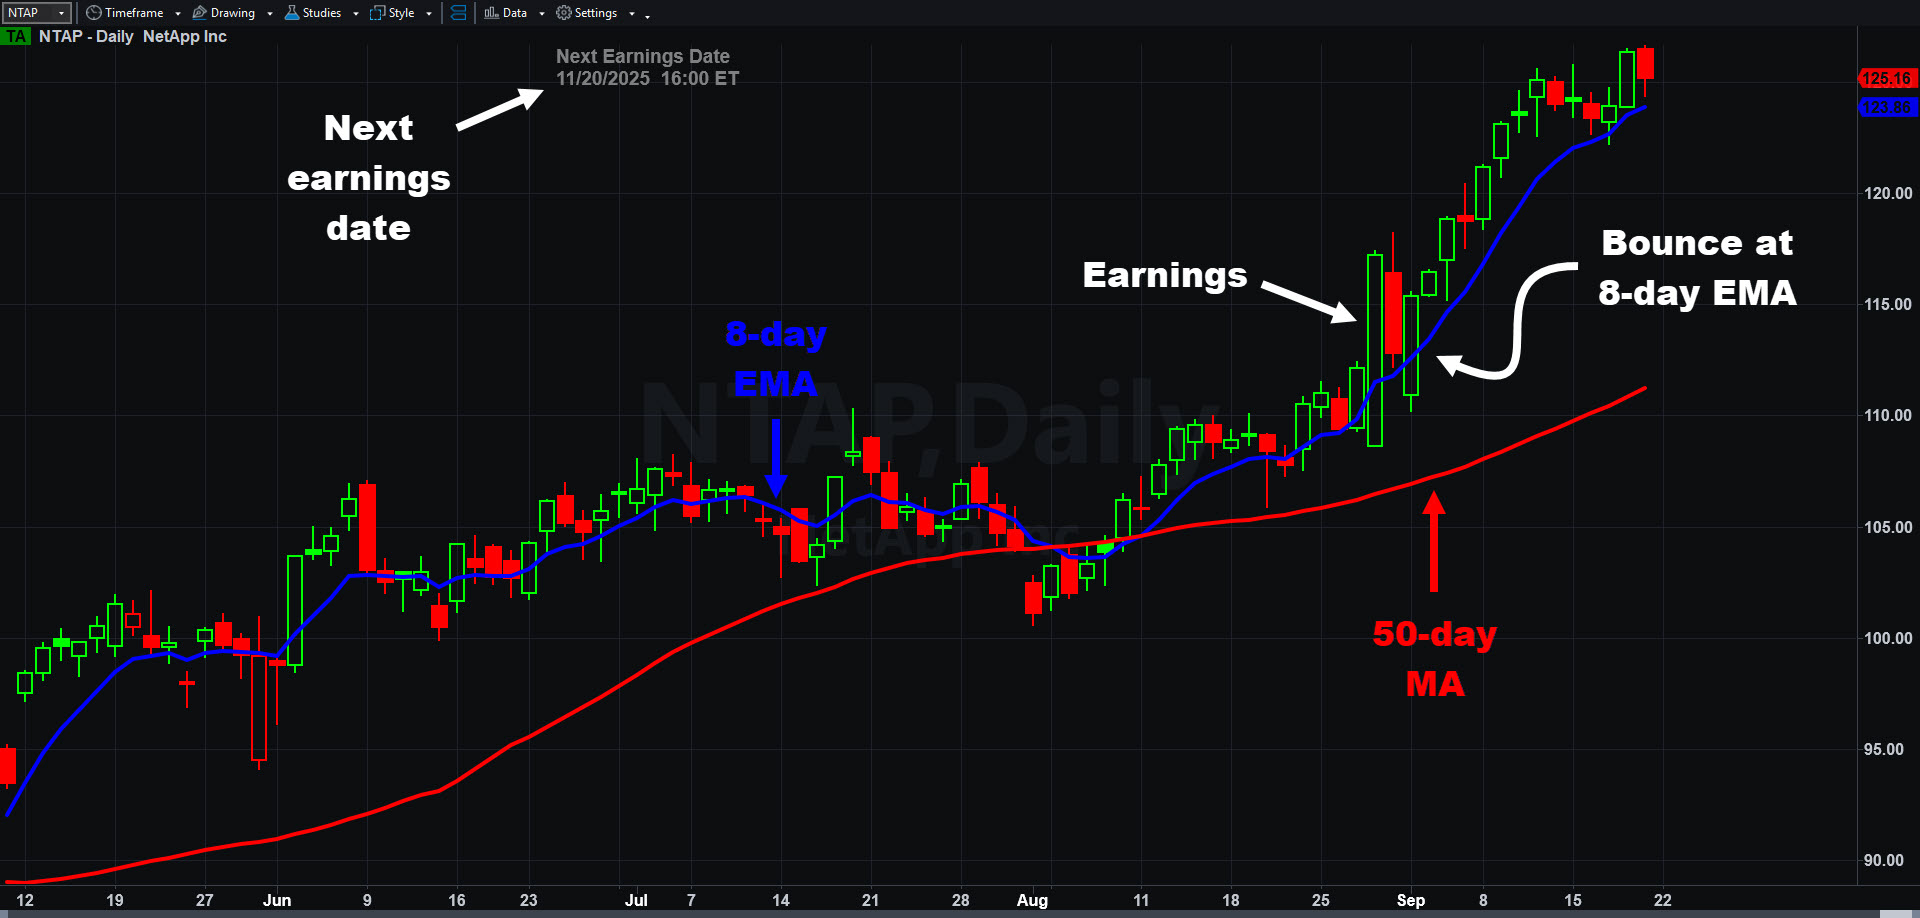
NetApp (NTAP), daily chart from the the included workspace. Notice how prices pulled back to hold the 8-day exponential moving average after the last earnings report.
Simple price alerts: The “Last” indicator doesn’t simply show the most recent price for a security. It can also send alerts when prices cross specific levels.
Dynamic price alerts: In addition to simple price alerts, TradeStation has dynamic alerts that adjust as prices change over time. The included workspace features three examples:
Dynamic alerts are also managed with the Inputs and Alerts tabs on the Customize Indicator dialog. Many other indicators on RadarScreen support similar kinds of dynamic price alerts.
ID3604708 D0524

Learn to use technical studies, customizable charting tools, and drawing features in TITAN X.

Explore how FuturesPlus supports futures spread trading with tools for product discovery, advanced filtering, MD Trader execution, Spread Matrix visualization, and custom spread construction using Auto Spreader. Review how to analyze and manage both exchange-listed and synthetic spreads within a structured trading workflow.

Welcome to HUB, which brings together direct market access and comprehensive portfolio oversight in a clean and efficient interface.