Downloads are available here. TradeStation’s ideas on TradingView are available here.
Next presentation: State of the Market on Monday, 9/15. (See Events page for more.)
Sizing Up the Market
- S&P 500 inching higher amid low volatility
- New record closing high of 6532
- 9-day rate of change (ROC) stays positive
- Wilder’s Relative Strength Index (RSI) above 50
- Intermarket: 10-year Treasury lowest since early April

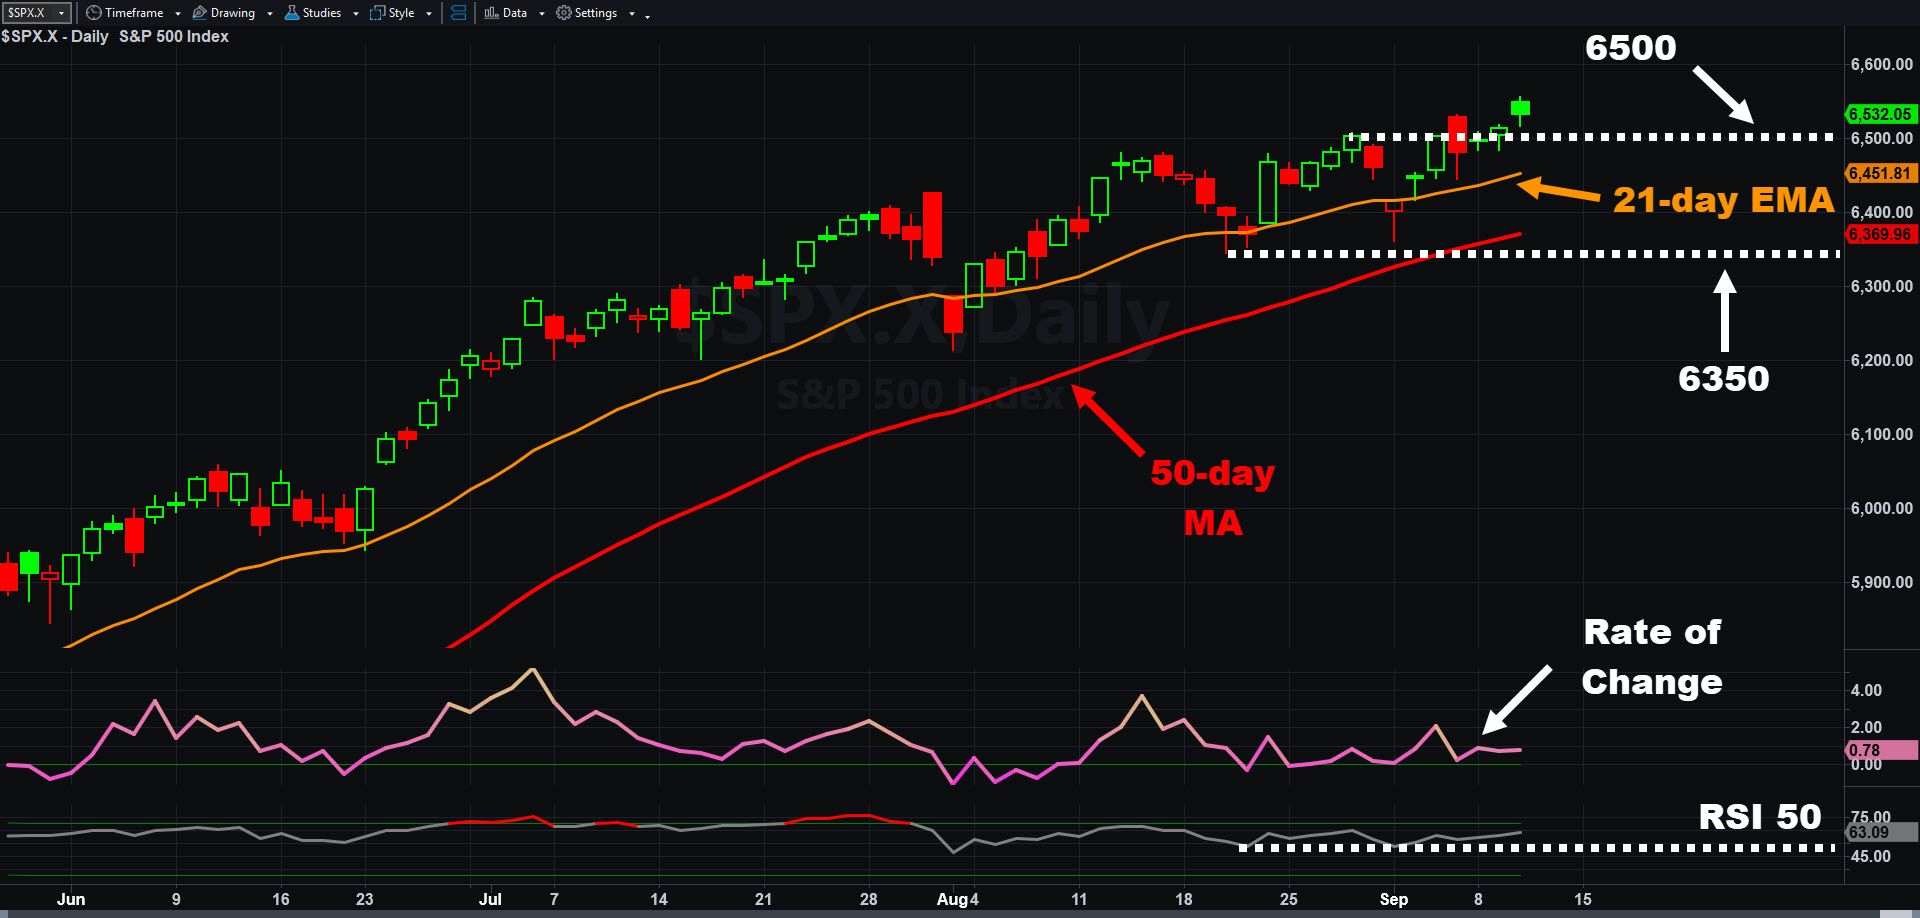
S&P 500, daily chart, with select patterns and indicators.
New Highs in New Stocks
Examples found with techniques listed below:
- BE: Fuel cells for data centers
- CCJ: Pure-play uranium miner
- CRDO: Fiber optics for data centers/AI
- FN: Fiber optics for data centers/AI
- CIEN: Fiber optics for data centers/AI
- SNDK: Data storage
- U: Adtech for mobile games
- CPNG: South Korean e-commerce
- RDDT: Future member of the S&P 500?
- PH: Old industrial with liquid cooling for data centers
Finding New Stocks
- Days Since 52wk HL (in zip file): displays days since highs. Can be used in RadarScreen or Scanner
- Distance from 52 Week High (in zip file): Plots today’s high against the 52-week high (as of last close)
- Scanner: Scanner Price → % of 52 Wk High/Low
- Plots current price relative to entire 52-week range (from 0 to 100)
- !IPO_tool (in zip file): displays days of history
- Reference against these values:
- RadarScreen: Customize → General “Additional bars to load”
- Scanner: + → Load additional data
- Hot Lists:
- Equities → Price Lists → Approaching 52Wk High%
- Equities → Price Lists → Approaching 52Wk High$
Upcoming Events
- Earnings tonight: ADBE
- Fri 9/12: Consumer sentiment
- Tue 9/16: Retail sales, industrial production, NAHB housing index
- Wed 9/17: Housing starts, crude-oil inventories, ** Fed meeting + dotplot **
- Thu 9/18: Initial jobless claims