Is the Clock Ticking With Hormuz Still Closed?

Chart of the Day: Is Transocean Trending Higher?
Transocean began the year with a steady rally. Now, after a brief period of consolidation, some traders may expect further gains.
Call toll-free 800.328.1267

Stocks face big tests as investors watch for signs of the Hormuz crisis improving.
The S&P 500 rose 3.4 percent in the holiday-shortened period between Friday, March 27, and Thursday, April 2. The bounce followed a drop to an eight-month low and ended a five-week losing streak. The index is also parked at a potentially key level. (See “Charting the Market” below.)
Attention remains focused on the Iran war and oil supplies. Stocks bounced last week on a hopes of a potential ceasefire. They fell again after President Trump said fighting may intensify. That continued over the weekend with a pledge to escalate if Iran doesn’t open the Strait of Hormuz by 8 p.m. ET, tomorrow evening.
The White House has also announced a press conference at 1 p.m. ET today featuring President Trump and members of the U.S. military.
A broader energy crunch remains a potential risk with the Strait of Hormuz closed. Asian countries like Bangladesh have already reported shortages, which have spread to European locations like Italian airports. Executives at companies like Shell (SHEL) and Chevron (CVX) said the market is underpricing the risk of shortages. Some analysts have also warned of a potential price spike in the first half of this month as the last pre-war barrels are consumed.
Four-fifths of the S&P 500’s members rose last week. Energy, which has led this year by a wide margin, was the only major sector to fall. Technology and communications, which remain deeply red on the year, led the rebound.
| SBA Communications (SBAC) | +22% |
| Lumentum (LITE) | +18% |
| Intel (INTC) | +17% |
| FactSet (FDS) | +15% |
| SanDisk (SNDK) | +14% |
| Source: TradeStation data |
Some niche areas may be showing signs of strength despite worries about the oil market:
Last week’s economic data showed a relatively strong labor market. Non-farm payrolls grew much more than forecast in March and initial jobless claims unexpectedly fell to a three month low. Retail sales also surprised to the upside.
However inflationary pressures continued. The price index in the Institute for Supply Management’s manufacturing report hit the highest level since June 2022. AMZN also announced a 3.5 percent fuel surcharge on some deliveries.
Nike (NKE) had the biggest decline in the S&P 500 after warning of a sharp slowdown in China. Sysco (SYY) plunged after buying a private restaurant supplier. Constellation Energy (CEG) slid after failing to announce new datacenter contracts at an investor day. The electricity company climbed on optimism about datacenter demand since 2024, but is struggling this year.
FactSet (FDS), which lost more than half its value in the second half of last year, bounced after raising its guidance. SBA Communications (SBAC) rallied on a Bloomberg report that the wireless-tower stock was exploring a sale.
| Nike (NKE) | -14% |
| Texas Pacific Land (TPL) | -13% |
| Sysco (SYY) | -13% |
| EQT (EQT) | -12% |
| Constellation Energy (CEG) | -9.5% |
| Source: TradeStation data |
Despite risks from the geopolitical situation, last week had positive news. Mizuho recommended buying Micron Technology (MU) and SNDK, saying memory-chip fears were overblown. GF Securities issued a similar note about memory-chip pricing. FactSet also reported that Wall Street sees earnings up 13.2 percent in the first quarter as an unusually high proportion of companies issue strong guidance.
Chart watchers may see few positives in the price action despite last week’s bounce.
For example, faster moving averages are below the slower ones. That may be consistent with a bearish trend.
The S&P 500 also made lower weekly lows and lower weekly highs, which could reflect a downtrend remains in effect.
Next, the index is under the 200-day moving average and only slightly above its lows since mid-September. Stalling here might represent a lower high and confirm longer-term weakness.
Traders may see potential resistance around March 23’s weekly high of 6,652.
Despite the apparent bearishness, some investors may think lots of negativity is priced in. They could also focus on positive seasonality in the second quarter.
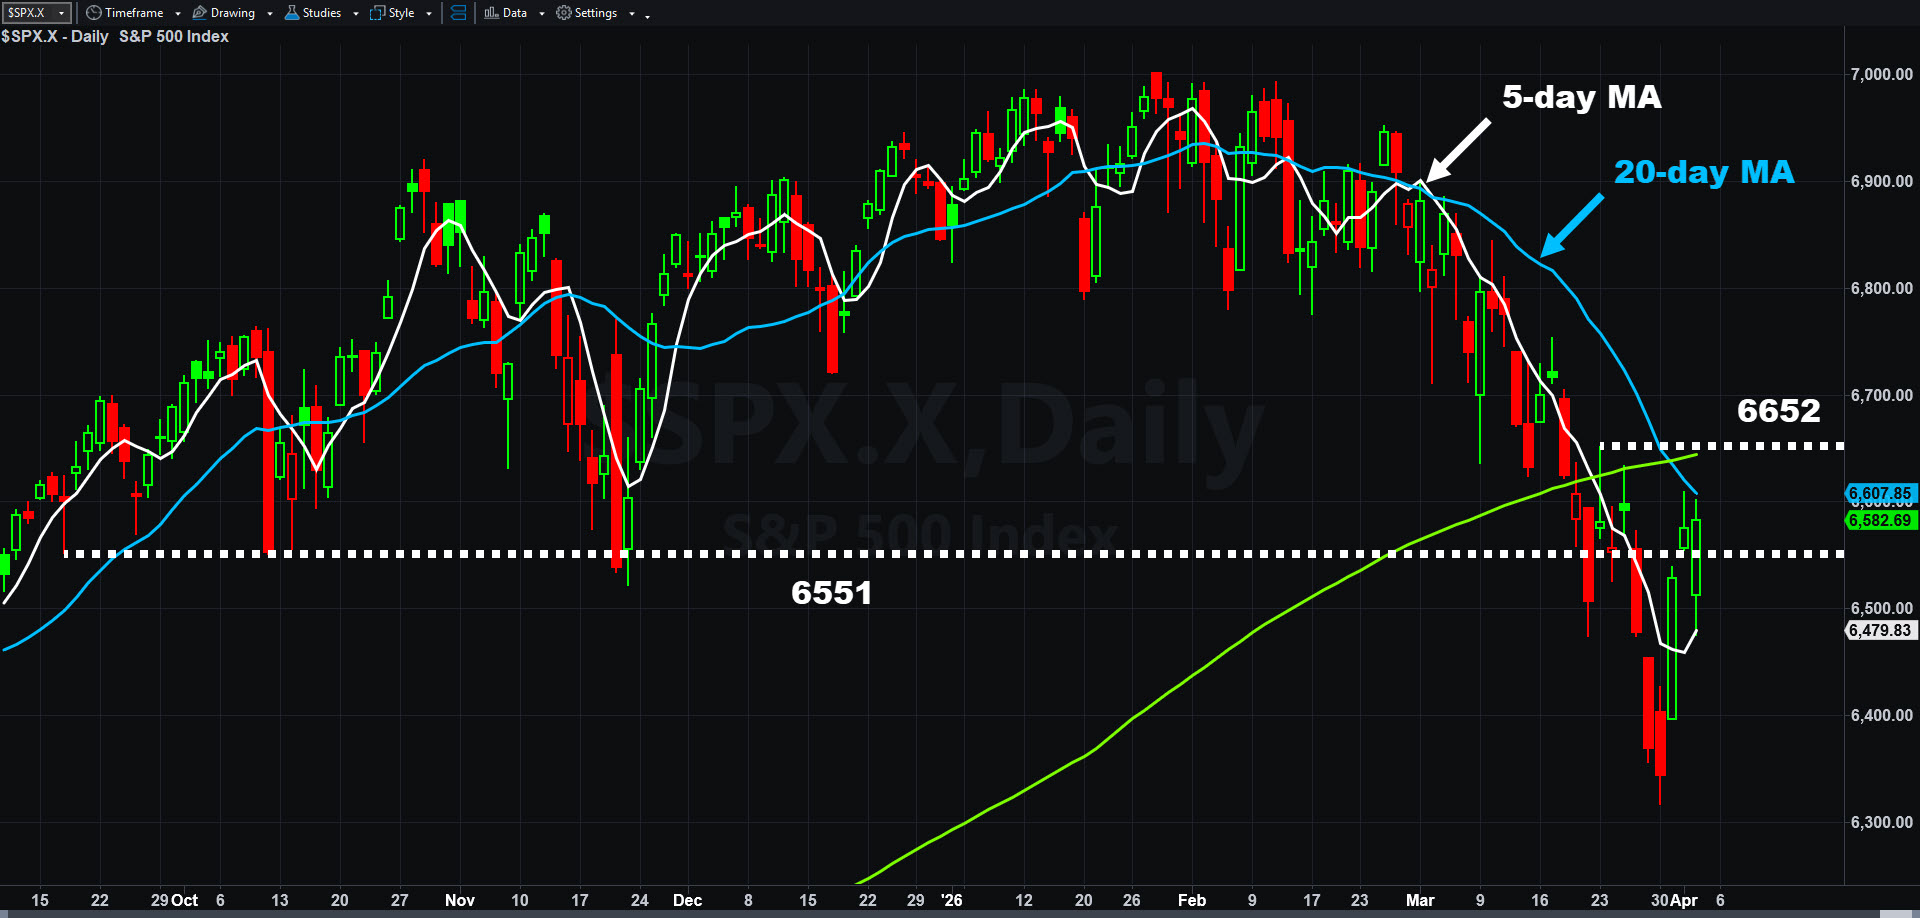
S&P 500, daily chart, with select patterns and indicators.
Announcements from the White House and developments in the Middle East could remain the big stories this week.
ISM’s service-sector index is the main economic report today and durable-goods orders are due tomorrow.
Wednesday morning features crude-oil inventories and results from Delta Airlines (DAL). Minutes from the last Federal Reserve meeting are at 2 p.m. ET.
The personal consumption expenditures (PCE) price index for February is on Thursday, along with initial jobless claims.
Friday brings the consumer price index (CPI) for March and April’s consumer sentiment report.

Transocean began the year with a steady rally. Now, after a brief period of consolidation, some traders may expect further gains.

The pain is growing on Wall Street as fighting escalates in the Middle East.

Vertiv has been a quiet beneficiary of the AI boom and now it’s getting noticed.