The next generation of our award-winning* platform has arrived, with powerful new tools and functionality.
TradeStation TITAN X includes key advances like:
- Multi-asset trading through a single integrated order ticket
- Fully customizable layouts
- Eleven chart types, including the newly added Equivolume and Heikin-Ashi bars
- Dual functionality on PC and Mac
- Multi-monitor support
- TITAN X can be downloaded here
The streamlined interface is designed to help advanced traders find, execute and manage opportunities in stocks, options and futures. It’s the cornerstone of an accessible ecosystem along with HUB, TradeStation Mobile App, API connections and our desktop platform.
Traders can access TITAN X by clicking “Sign in” at the top of TradeStation.com. This opens HUB, the centralized starting point for brokerage accounts. Users can scroll down the home page for Platforms and tools, or click the Platforms button (∷) on the left. Clicking on the Download button will begin the installation process.

TITAN X home page, showing prebuilt and user layouts. Tabs at the top display open layouts.
Layouts as You Want Them
TITAN X includes prebuilt layouts. Customers can also create and customize workspaces that are automatically saved for the next time they log in.
Clicking the home icon (⌂) in the top toolbar opens a series of prebuilt layouts such as Day Trader, Futures and Options. Each contains various tools like Chart, Watchlists or Orders arranged for different trading styles. Clicking on a layout opens a new tab. Users can modify these by adjusting the size of windows or adding new tools.
See this previous article for more on adding and arranging components within layouts. It also covers the new functionality for trading options and the multi-asset order ticket.
The layout can be renamed by double-clicking on its tab and typing. TITAN X automatically saves layouts and loads them the next time you log in. They’re also available in the My Layouts section on the home page.
Note: Traders can drag a tab out of TITAN X to create a separate workspace on another monitor. Tabs can also be dragged into another window to attach them there.
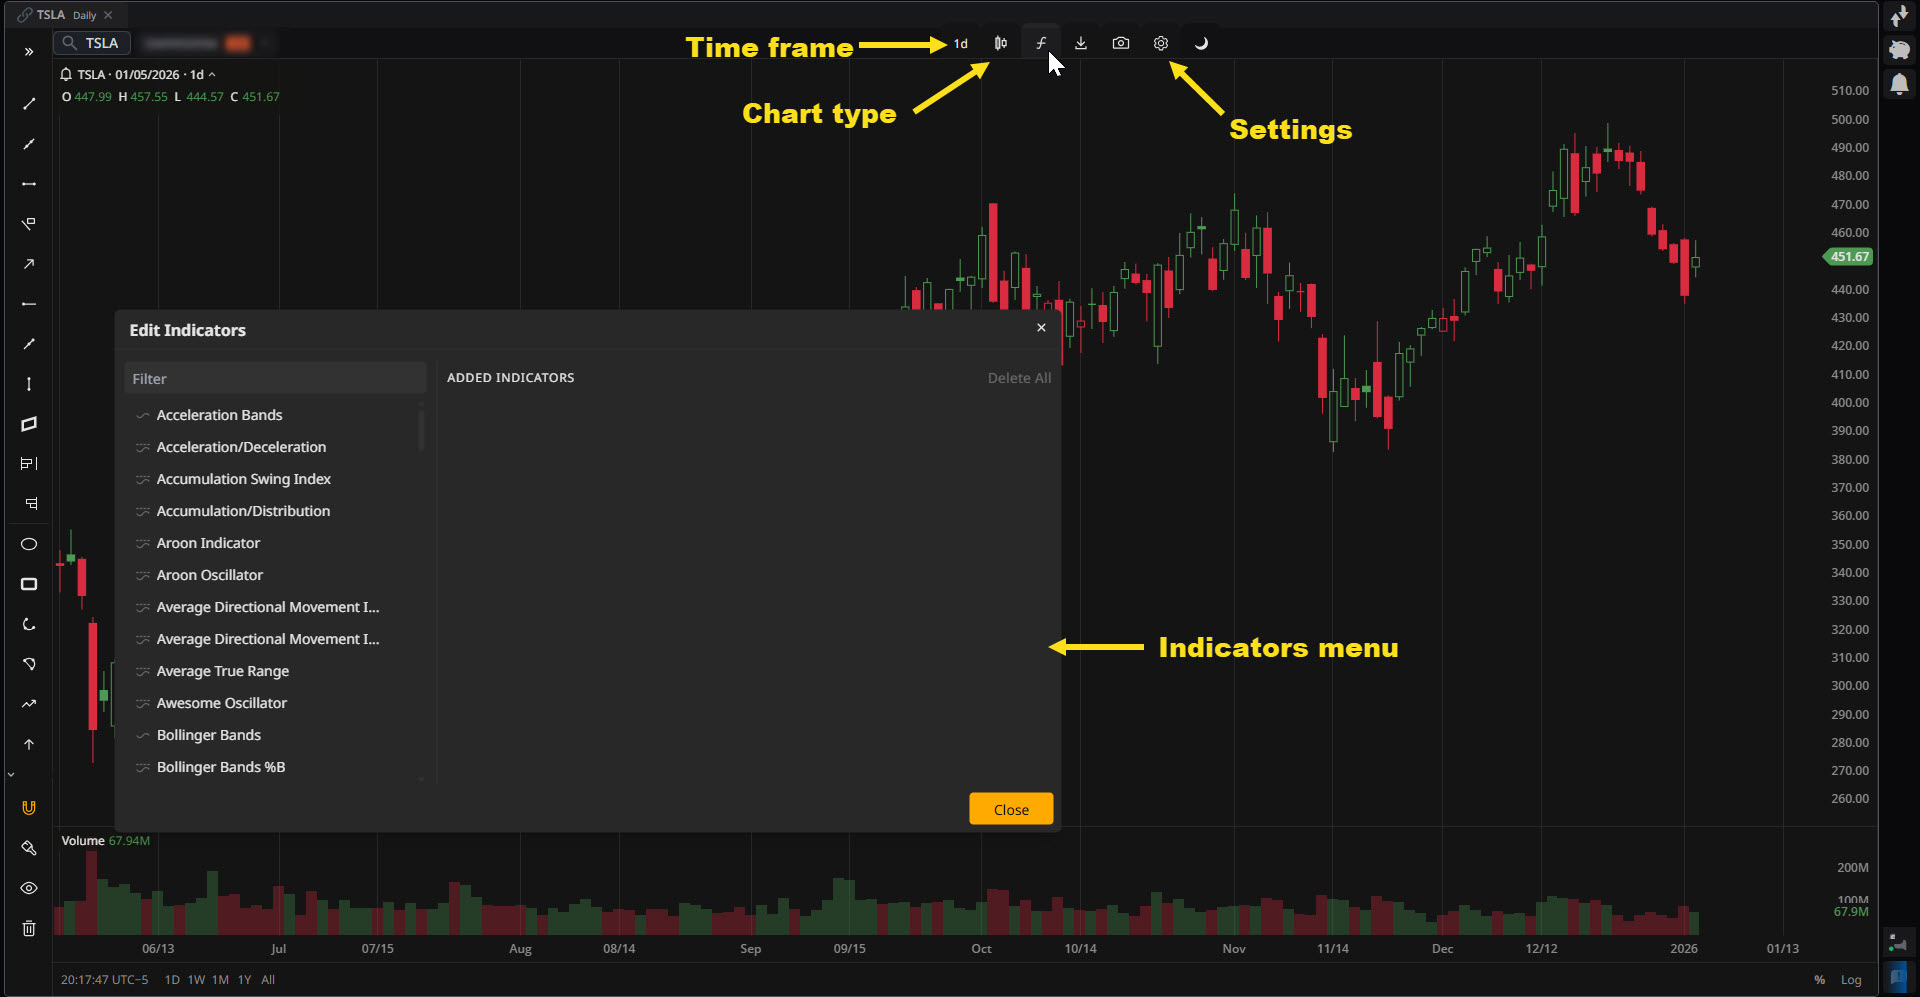
Tesla (TSLA), daily chart, on TITAN X, showing select controls and settings.
Advanced Charting
TITAN X supports an unlimited number of charts for simultaneously watching multiple markets and time frames.
Users can launch Charts from the components icon in the top navigation bar. They can begin typing in the search box to input a symbol or search by name. Buttons along the top of the dialog box allow filtering by asset class like Equities, Options, Futures or Index.
Charts can be configured with controls at the top of the window.

TITAN X toolbar, showing available components.
Time frame: Users can select from short-term intraday time frames like 1 minute to long-term monthly periods. Custom intervals are also available.
Chart type: Users can select common variations like candlesticks, lines or bars. These new types are now available:
- Equivolume charts widen a bar’s horizontal thickness to display heavier volume. This helps identify sessions or periods with greater trading activity.
- Heikin-Ashi charts smooth price action by averaging data to highlight trend instead of showing exact market prices.
Indicators (f): Users can choose from a wide range of studies like moving averages, relative strength index and Ichimoku clouds.
Settings (⚙︎): This button includes several key controls. Here are some of the most important:
- General: Controls the grid. You can also toggle whether to display the highest and lowest chart values.
- Trading: See orders and positions for the displayed symbol. (Chart-based traders, this is for you!)
- Legend: Controls various aspects of scaling, plus countdown to bar close.
- Colors: Adjust colors like the background or numbers in the axes. You can also change the color of bullish/bearish price bars.
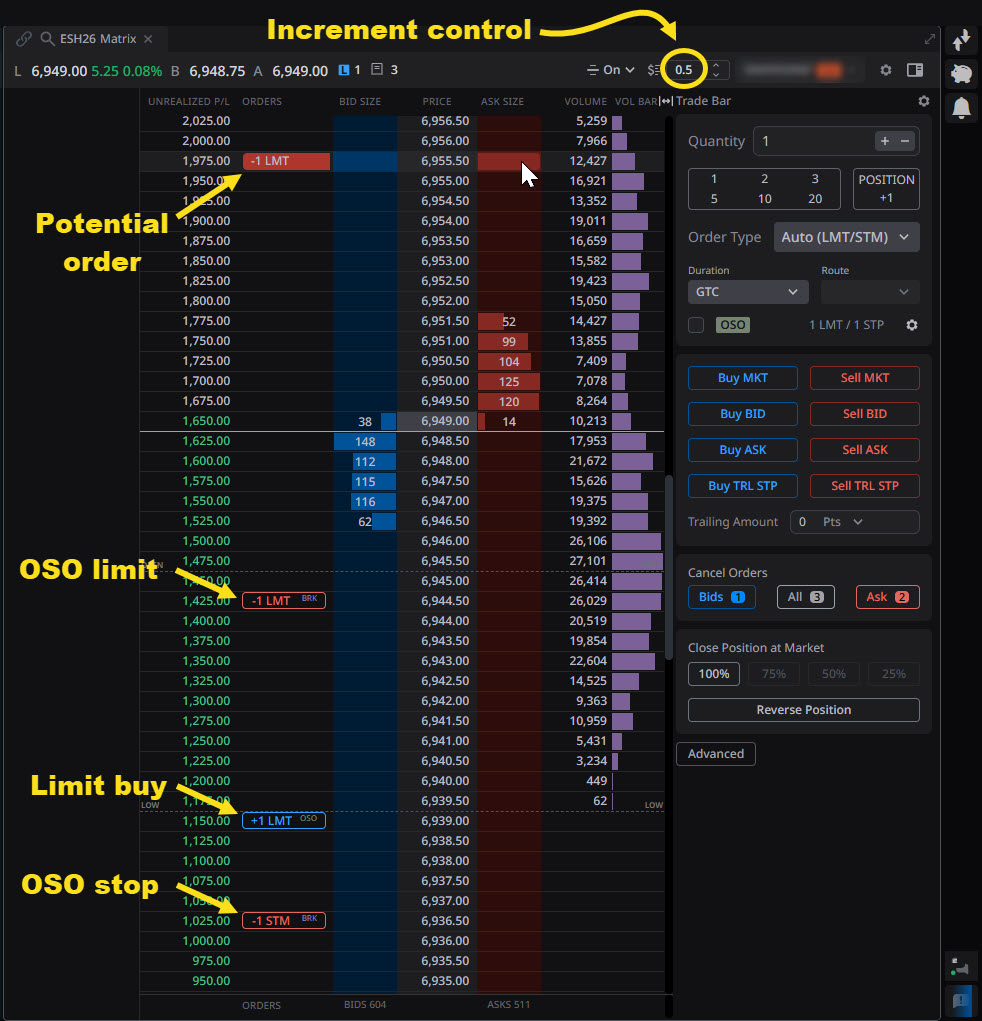
TITAN X Matrix, highlighting select functionality.
Note: Dragging on an axis can adjust zoom. Double-clicking the axis restores the default view.
Next Generation Matrix
TITAN X also brings significant advances in the Matrix trading tool, which displays orders in an easy-to-view vertical ladder.
Dynamic market depth is displayed in real-time bars that can help you visualize potential support (many bids) or resistance (lots of offers). A third column shows the volume of executed trades at each price.
Users can trade directly in the Matrix by hovering their mouse cursor on the blue BID SIZE column or the red ASK SIZE column. Clicking will place the order, which can then be dragged up or down.
Hovering over the order also lets you:
- Cancel the order
- Add stop and limit orders. These will be submitted as OSO (“one-sends-other”), meaning they will only be sent if the initial entering order is filled.
The Price Increment box is another breakthrough in the TITAN X Matrix. This control allows users to aggregate depth-of-market and volume data around bigger increments. That can be especially useful for products like E-mini S&P 500 futures, which trade in 0.25 ticks. (Increasing the increment makes more price action visible in Matrix.)
* – Visit www.TradeStation.com/Awards to learn more.