RadarScreen is one of TradeStation’s most powerful tools. If you’re new to our platform here are some basics to get you started with this versatile application.
What Does RadarScreen Do?
First, what does it do? RadarScreen is a customizable grid that can track and analyze hundreds of symbols in real time. It can watch stocks, futures, cryptocurrencies and indexes. Countless studies can be added, triggering alerts and allowing customers to compare a wide range of metrics.
For example, if you want to see which members of the S&P 500 are up the most today or trading the most volume, RadarScreen can quickly deliver the data. It can also watch the entire index and fire alerts when based on events like crossing a moving average, candlestick patterns and overbought/oversold conditions.
RadarScreen can also talk to other apps in your workspace via symbol linking. That can automatically load symbols into Chart Analysis or trading tools like Matrix.
How Do You Launch RadarScreen?
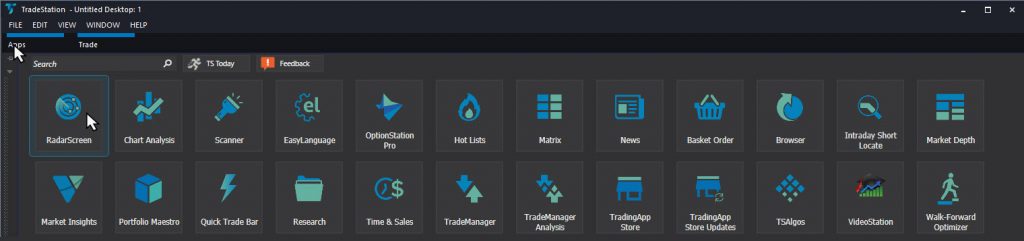
RadarScreen is an app on the desktop platform. Users can access it by:
- Hovering over the App button on the top left and selecting the RadarScreen logo. (Shown on the right.)
- Right clicking on the desktop background and selecting “New Application” and then RadarScreen.
RadarScreen will first appear as a simple blank grid. Continuing with our S&P 500 example, you could click Data → Add Symbol List → S&P 500. This will automatically populate the entire S&P 500.
Clicking on the column headers will sort by the column. For example, clicking on Net % Chg will toggle the column between biggest gainers and decliners in the S&P 500.
Common Steps with RadarScreen
Experienced users of RadarScreen often use other features to navigate the data more easily.
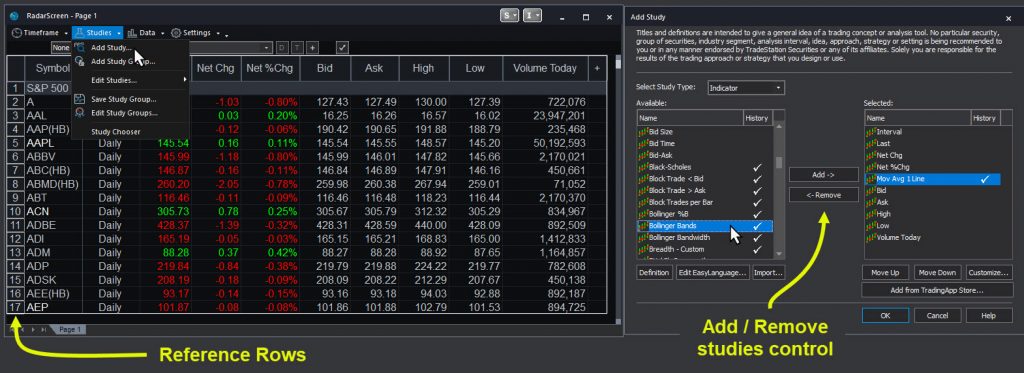
One common action is to add row numbers, which helps to sort and rank symbols. Click on Settings → Page. Then on the General tab click the box for “Reference Rows.”
Another useful functionality is the ability to add and rename tabs across the bottom. “Page 1” appears automatically, but you can rename this by right clicking and selecting “Rename Page.” You can also add a new tab by right clicking and choosing “Add New Page – Blank.”
Customers might want to add tabs to RadarScreen to keep different lists separate. They might also have different sets of indicators, which we’ll consider next.
Setting Alerts With RadarScreen
All the columns are considered Studies, even simple data points like last price and percentage change.
Many of these studies support alerts that can pop up on your PC or play an audible notification. The easiest way to learn these alerts is to double click on a cell, which opens a Customize Indicator dialog box. Click the Alerts tab on the left. This will let you chose to Enable the alert. You can also configure its settings to alert once or continuously.
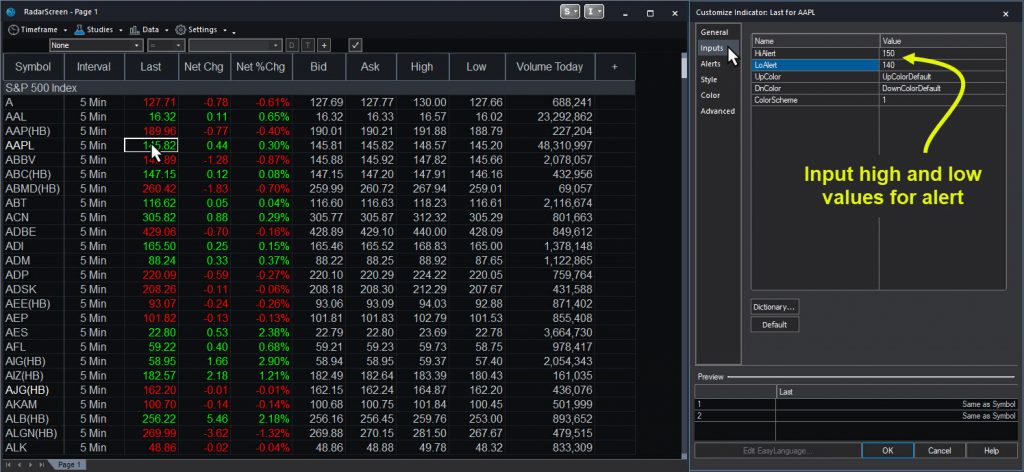
If you want to set a simple price alert, like when a stock crosses a certain level, double click on a cell in the Last column. Select the Inputs tab and enter numbers for HiAlert and LoAlert. These are the high and low values that will trigger the alert. Next use the Alerts tab to enable the alert.
Basic studies like Bid, Ask, High, Low and Volume Today function similarly. Other alerts can deliver more advanced notifications, like when a stock crosses a moving average or reaches the top of a Bollinger Band.
Adding Indicators to RadarScreen
This next step requires adding indicators to RadarScreen. Click Studies → Add Study. A dialog box will appear. Scroll down the list on the left and select studies to add by clicking the “Add ->” button in the middle. The right list shows the current studies, which can also be reordered with the “Move Up” and “Move Down” buttons.
This is where users can select studies like:
- Mov Avg 1 Line: This plots one simple moving average. The alert will tell you when the price crosses the moving average.
- Mov Avg 2 Line: This plots two simple moving averages. It generates “bullish” or “bearish” alerts when the faster moving average rises or falls through the slower moving average.
- Bollinger Bands: This tool calculates price envelopes based on recent volatility. Its “%B” column shows where current price stands in the projected range. It generates alerts when prices touch the outer bands.
- RSI: Short for “relative strength index,” this popular oscillator shows when stocks are potentially overbought or oversold.
- Mov Avg Exponential: This plots one exponential moving average, which adjusts more quickly to recent price changes. Its alert tells you when the exponential moving average changes direction.
Adjusting Studies
Studies like moving averages and RSI have inputs that you can adjust. There are two ways to change the inputs.
First, right click on the column header → Studies and edit the study in question. This will let you set values down the entire set of stocks, useful for a big list like the S&P 500.
Alternately, you can select several cells and right click to adjust only their values.
Adjusting Time Intervals
You might notice that RadarScreen defaults to “5-min” intervals. This might confuse some of your analysis because it will make indicators like moving averages calculate based on 5-minute bars instead of daily values. This can be changed by selecting a row, clicking the Timeframe menu and selecting “Daily” or “Weekly.” You can also type Ctrl-A to select all before changing the interval.
An interesting thing about this functionality is that it allows you to view multiple time frames on a single RadarScreen page.
In conclusion, RadarScreen is a powerful tool letting customers perform a wide range of analysis. You can track stocks, sort them and set a wide range of alerts. Future posts will cover more aspects of arranging your grid, managing symbol lists and performing more advanced kinds of analysis.