Market Insights
Opportunity knocks for those with trading in their DNA.
Curiosity creates opportunity. Insights create strategy. Born traders create their destiny.
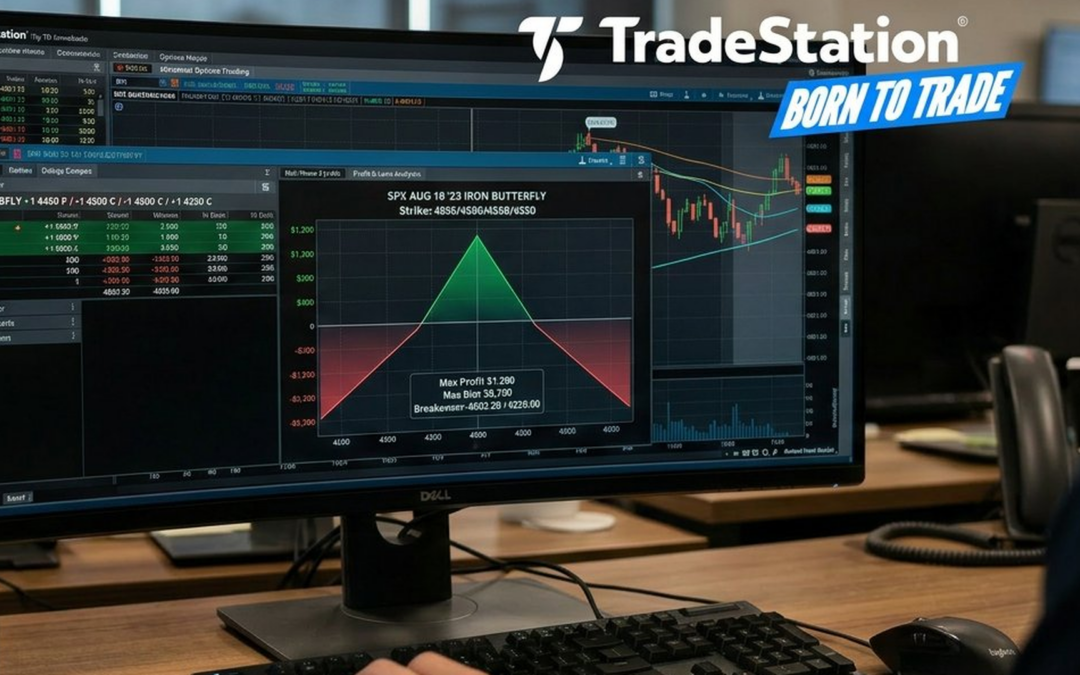
Iron butterfly options: how to analyze before you trade
The iron butterfly setup: when your tools can't keep up You've been watching this stock for two weeks. It's pinned between support and resistance like it's bolted to the floor. Implied volatility is elevated. The premiums are fat. You pull up the options chain and...

Netflix Falters as AI Lifts Other Stocks
Netflix has struggled as AI trades dominate the market. Is the long-term growth stock finally stalling?

Jade lizard options strategy: from strike selection to fill
You modeled the perfect jade lizard. Then the market moved between clicks. One fill slipped, the credit condition broke, and the defined-risk trade in your head became a different position entirely. This is the hidden execution problem with multi-leg premium selling — and why advanced strategies need more than a one-leg workflow.

Nasdaq Keeps Running as Bulls Move to Software
The Nasdaq-100 keeps running as the AI boom widens across the technology sector.

Platform Tools for Market Internals and Breadth
TradeStation’s platform is known for letting customers build their own tools. It also provides a series of calculated indexes for advanced technical analysis.

Ratio diagonal spread options: how to analyze before you trade
You’ve mapped the ratio diagonal, but the picture fractures when you try to model the actual risk.

Good-Bye $25,000 Day Trading Limit. What’s Next?
For 25 years, four trades in five days could lock you out of your own margin account. That era is ending.
Technology & Communication

Netflix Falters as AI Lifts Other Stocks
Netflix has struggled as AI trades dominate the market. Is the long-term growth stock finally stalling?
Are Amazon.com Bulls Targeting New Highs?
Amazon.com is fighting to new highs, and one big options trader seems to expect a bigger move.

Chart of the Day: Potential Breakout in Apple
Apple has been snoozing for months, but there could be signs of a breakout

Growth Stocks Return as Nasdaq Breaks Out
Growth stocks could be staging a comeback as May begins. Learn more about AI’s broadening effect and the growth in Apple.
Stocks Climb as AI Demand Shifts to CPUs, Analog
The next phase of the AI trade could be taking shape as investors scramble for CPUs and analog chips.