TradeStation is known for its powerful charting tools. Today we’ll explain how to analyze two or more stocks in a single chart.

Start by opening a new chart on TradeStation’s desktop platform. Click on the Apps bar at the top of the workspace and select the Chart Analysis tool.
You can add a stock by simply typing its ticker, or by clicking on the chart’s input box on its top left. We will add Apple (AAPL) for the sake of illustration. This will show a basic candlestick chart of AAPL.
Adding Another Symbol
You can add another symbol by clicking on Data → Add Symbol. We’ll add Exxon Mobil (XOM) for the sake of illustration. A second price chart of XOM will appear below the main AAPL chart.

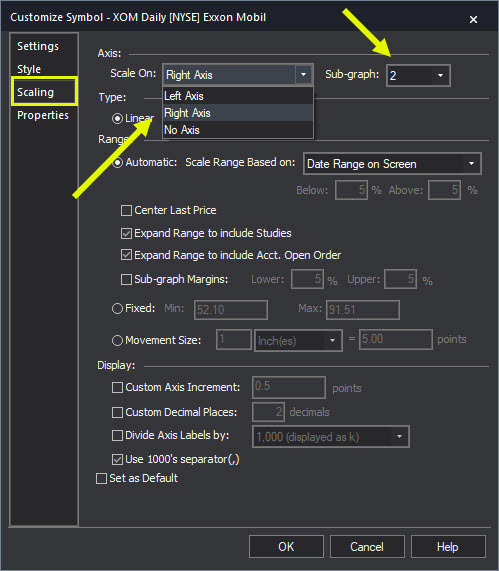
To compare them more easily, click on Data → Edit Symbol. It will bring up a list of the symbols on the chart, with AAPL listed as Data1 and XOM appearing as Data2. Double clicking on Data2 will bring up the dialog box “Customize Symbol.”
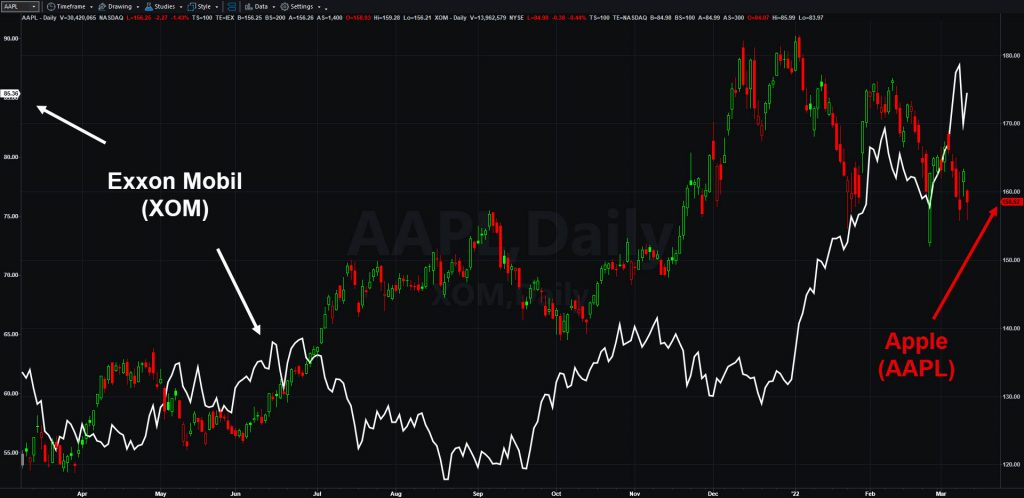
Click on the Scaling tab to the left. Notice the Axis control, which defaults to Right Axis and Sub-graph 2. Changing the Sub-graph to 1 will place XOM’s price on the same chart as AAPL. However this creates a problem because the two stocks trade for widely different prices. (AAPL closed yesterday at $158.22 and XOM closed at $85.36.)

You can quickly fix the problem by changing F’s scaling from Right Axis to Left Axis.
However one more thing needs to be done. Both stocks will have similar-looking candlestick charts that will be hard to differentiate.
You can fix this issue by clicking on the Style tab to the left. Using the Bar menu at the top left you can change F from a candlestick to “Line on close.” This will display prices as a single line without open, high and low. You can also adjust the color and weight (thickness) of the line with the drop-down menus to the right.
Click OK and you’ll see a chart with candlesticks of AAPL and a line chart of XOM. You’ll also notice that their prices appear on the two axes, with matching colors.
Adjusting Time Frames
Next, you might want to adjust the time frame. This can make the comparisons cleaner by ensuring that both charts begin at the same place on the left of the chart.
Once again, click on Data → Edit Symbol. Now double click on either symbol and go to the Settings tab on the left side of the dialog box. You can set the date range on the right. This will automatically apply to both symbols.
Working With Percentage Charts
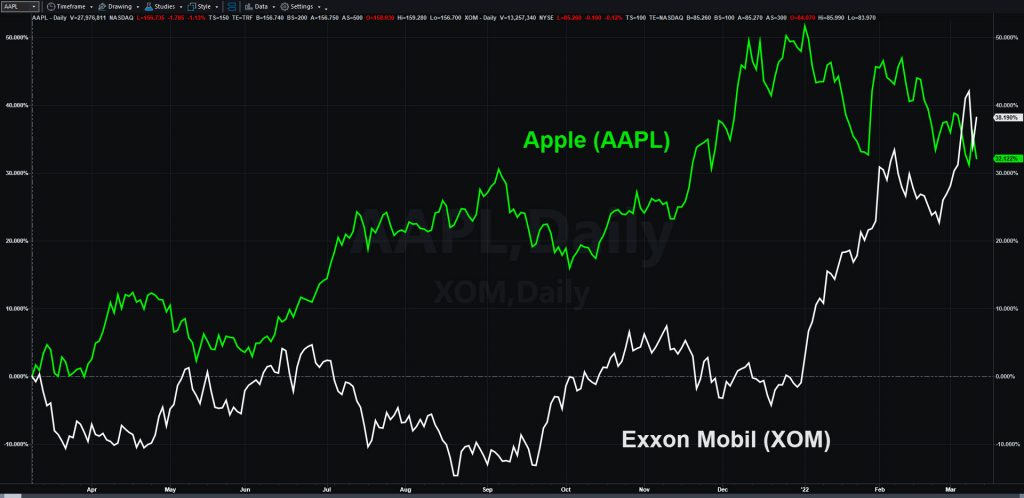
The method described above will show both AAPL and XOM as simple price charts. You can also compare them as percentage charts with a dropdown menu at the top of the Chart Analysis window: Style → Percent Change Chart → Enable.
This will automatically unite the scales of both charts based on percentage change. It will start with the first date (from the left) by default, showing how prices diverged. However you can change this to the last bar on the chart by clicking on Style → Percent Change Chart → Calculate from last bar.
Working With More Symbols
Say you want to compare three or more stock tickers. There are two possible approaches.
First, if you are already using a percentage change chart, you can simply add more symbols. Click on Data → Add Symbol.
Second, simple price charts are more difficult because they only have right and left axes. Adding a third stock will force you to plot more than one stock on a single axis.

In this case, you can display the different symbols in different charts. Go to Data → Edit Symbol, then double click on one of the symbols. The Customize Symbol dialog box will appear. Click on the Scaling tab on the left and change Sub-graph to No. 2, 3 or another value. Making this adjustment for each symbol will let you move them between different charts in the bigger charting window.
In conclusion, TradeStation charts can plot multiple symbols. You can easily compare two stocks in a single chart by plotting each to a separate axis. You can also display them with percentage changes, allowing even more symbols in a single display. Finally, you can plot them in different charts (one on top of the other) with the Sub-graph control.


