Market Insights
Opportunity knocks for those with trading in their DNA.
Curiosity creates opportunity. Insights create strategy. Born traders create their destiny.

Insights AI: A Partner for Active Traders
Active traders are always studying headlines and price moves. TradeStation now has a machine-powered tool to make that process easier.

Assessing the Market With Sector Performance
Market internals is a field of technical analysis that considers how companies within the stock market are performing. Learn more here.
Trading in TITAN X: Placing and Managing Trades
An overview of TradeStation TITAN X trading tools, including chart-based order entry, OCO functionality, and integrated risk management features.

Chart of the Day: Are the Bears Riding Uber?
Uber Technologies has dropped since late 2025, and some traders may see further downside in the ride-sharing stock.

Energy Regains Leadership as Inflation Surges
Energy stocks are leading the market again as inflation surges and earnings season winds down.
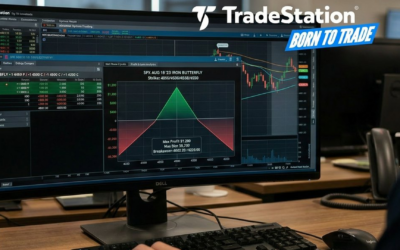
Iron butterfly options: how to analyze before you trade
The iron butterfly setup: when your tools can't keep up You've been watching this stock for two weeks. It's pinned between support and resistance like it's bolted to the floor. Implied volatility is elevated. The premiums are fat. You pull up the options chain and...

Netflix Falters as AI Lifts Other Stocks
Netflix has struggled as AI trades dominate the market. Is the long-term growth stock finally stalling?
Technology & Communication

Chart of the Day: Are the Bears Riding Uber?
Uber Technologies has dropped since late 2025, and some traders may see further downside in the ride-sharing stock.

Energy Regains Leadership as Inflation Surges
Energy stocks are leading the market again as inflation surges and earnings season winds down.

Netflix Falters as AI Lifts Other Stocks
Netflix has struggled as AI trades dominate the market. Is the long-term growth stock finally stalling?
Are Amazon.com Bulls Targeting New Highs?
Amazon.com is fighting to new highs, and one big options trader seems to expect a bigger move.

Chart of the Day: Potential Breakout in Apple
Apple has been snoozing for months, but there could be signs of a breakout