Stocks just had their biggest rally in 45 years on hopes the coronavirus crisis is ending. Now comes the hard part.
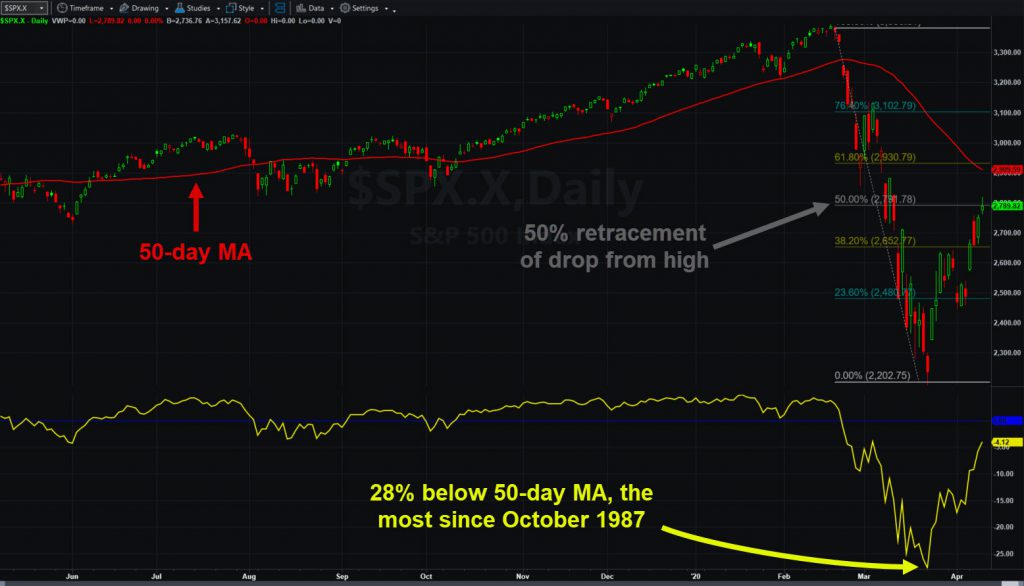
The S&P 500 rose 12.1 percent in the holiday-shortened week between Friday, April 3, and Thursday, April 9. It was the biggest weekly gain since October 1974, narrowly beating a week from November 2008. The index has now retraced about half its drop since late February.
Signs of the Covid-19 outbreak easing have spurred optimism that life will return to normal soon. That could end an unprecedented wave of social distancing that’s erased millions of jobs and triggered one of the fastest contractions in economic history.
Continuing jobless claims needed two full years to increase by 4 million between March 2007 and March 2009. In 2020, it spiked by 5.7 million in just three weeks. (Higher readings mean more Americans are out of work.) Other metrics — especially consumer sentiment — are also having their worst drops ever.

Oversold Bounce?
The S&P 500 was almost 28 percent below its 50-day moving average in late March. That was the most since the October 1987 crash. The index additionally had its fastest correction ever, along with its worst week, worst month and worst quarter since the subprime crisis.
Every major sector rose last week, although stocks that fell the most since the outbreak led the bounce. That included retailers, cruise ships, banks airlines and small caps.
The weakest stocks were companies that had rallied on hopes they’d benefit from coronavirus. That included health care and consumer staples. All told, a mere 9 members of the index declined last week.
| Biggest Gainers in S&P 500 Last Week | |
| Kohl’s (KSS) | +73% |
| Royal Caribbean Cruises (RCL) | +65% |
| Nordstrom (JWN) | +63% |
| Gap (GPS) | +61% |
| PVH (PVH) | +60% |
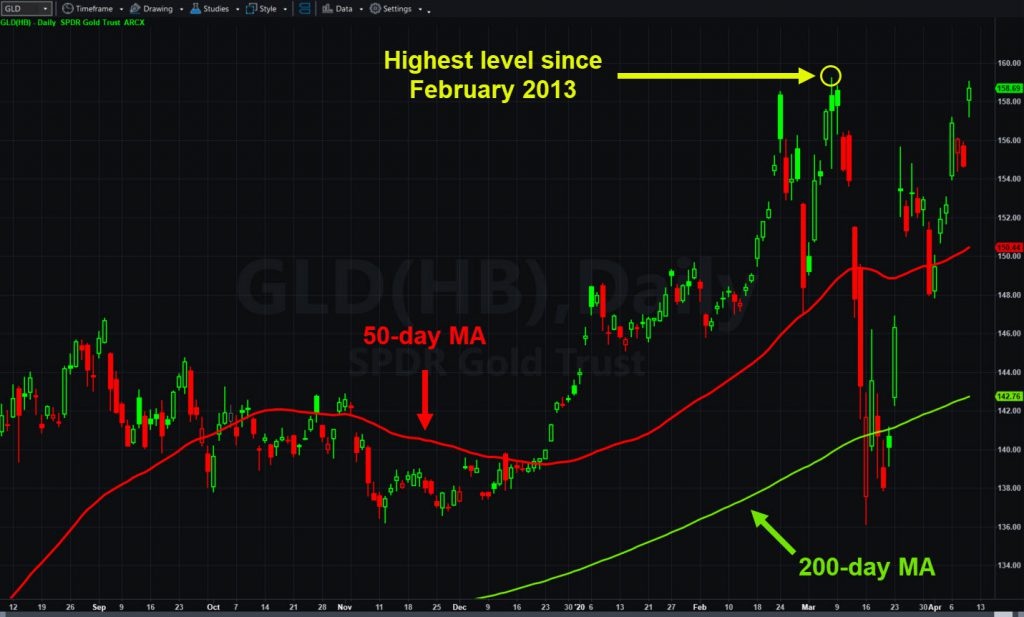
The Market Vectors Gold Miners ETF (GDX) also rallied 16 percent. It’s one of the few major industry groups that’s above both its 50- and 200-day moving averages. The reason has been historical money-printing by a Federal Reserve trying to support the economy. The SPDR Gold Trust (GLD) may be on breakout watch this week.
Oil Production Slashed
Energy was another big story last week after global oil producers lowered production. They initially talked about a 10 million barrel reduction by Thursday. They ended up with a 9.7 million barrel cut three days later.

The group, known as OPEC+, included Saudi Arabia, Russia, the U.S. and Mexico. Their action was massive by historical standards, but they had little choice after coronavirus wrecked global energy demand.
| Gilead Sciences (GILD) | -6% |
| Kroger (KR) | -3.8% |
| Campbell Soup (CPB) | -3.6% |
| Hormel Foods (HRL) | -1.7% |
| Citrix Systems (CTXS) | -1.4% |
That gets us back to the key issue of the pandemic. It caused this crisis, and will likely remain the primary catalyst investors watch. If cases fall, the market could price in a return to normal and look past more bad economic news. The opposite could also apply if the disease lingers — regardless of what the Fed or Congress do in response.
Earnings Season Begins
Earnings season, which begins this week, could be similar. Companies like Starbucks (SBUX) have said it’s impossible to forecast anything right now.
Banks are the main group to report the next few days. They’ve already plunged on worries about delinquent loans after millions of Americans lost their jobs. Here’s a rundown of things to watch:
Tuesday: JPMorgan Chase (JPM) and Johnson & Johnson (JNJ) announce earnings.
Wednesday: Bank of America (BAC), Citigroup (C), US Bancorp (USB) and UnitedHealth (UNH) issue results. Retail sales, NAHB’s housing-market index and the Fed’s Beige Book economic recap are also due.
Thursday: Initial jobless claims, housing starts and building permits.
In conclusion, market has begun to see light at the end of the coronavirus tunnel. Now let’s see whether the crisis is actually ending.


