Money streamed back into equities today as the stock market seemed to anticipate an end to the coronavirus lockdown.
All the major indexes climbed at least 2 percent amid signs the outbreak is easing. These events helped fuel the move:
- Smaller European countries like Denmark eased social-distancing rules.
- White House adviser Anthony Fauci said shelter-in-place rules have worked and predicted a turnaround in the U.S.
- New York reported hospitalizations have stabilized.
On top of that, oil rallied on hopes of a production cut by Saudi Arabia and Russia. That eased worries about debt-laden energy firms across America going bankrupt.
Let’s review other key things happening in the market.

Volatility Collapses
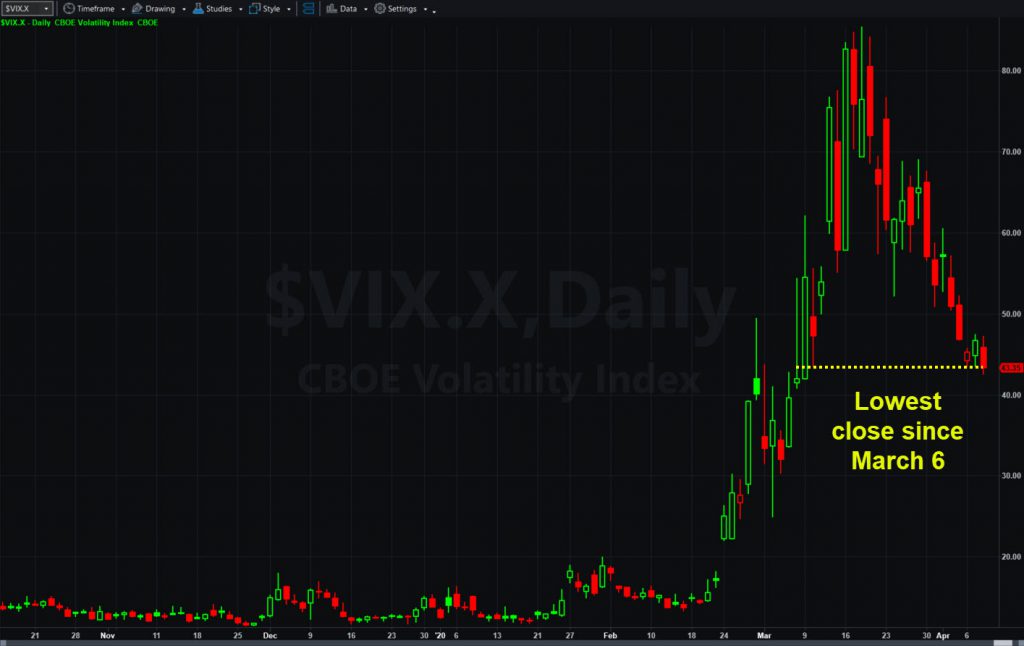
Cboe’s Volatility Index, ($VIX.X), closed ended Wednesday at 43.35 — its lowest close March 6.
The VIX shows the level of fear in the market. When it drops, investors are more willing to take risk.
Volatility also increases correlation across the market. Good stocks may fall for no reason and weak stocks may rally. But the pattern abates when volatility eases. As a result, it may be easier to trade companies based on fundamentals. Stock picking returns, and index trading loses importance.
Lower volatility also makes options cheaper and narrows their bid/ask spreads. Traders can capitalize on this by selling premium in the near term. Down the road, it will be easier to take directional positions by purchasing calls and puts.
Yield Curve Steeper
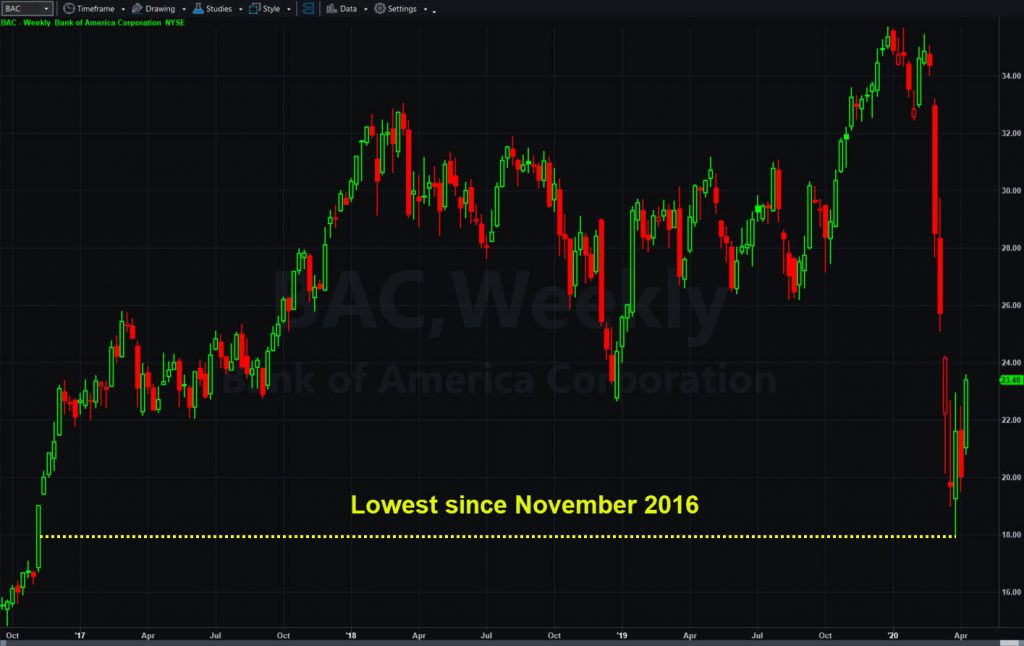
Banks and financials had some of the biggest declines in the market when Covid-19 hit. Investors worried about increased defaults and low interest rates.
But something else happened: The difference between short- and long-term rates widened. That relationship, known as the yield curve, is a key driver of lender profitability.
The yield curve hit a two-year high in late March and remains above its peaks from all of 2019. There may be reason to see this continuing because the Federal Reserve has pledged to keep short-term rates low well into the future.
Meanwhile, the U.S. government is running up record deficits to pay for coronavirus bailouts. The Treasury Department will finance these gaps by borrowing in the longer-term.

In other words, Jerome Powell is keeping the short end of the curve down while Steve Mnuchin pushes up the long end.
This, combined with a rebound in the economy, could make investors think the tide will turn for banks and financials.
Is the Tsunami Receding?
Speaking of tides, the coronavirus outbreak was like a tsunami. It swept the entire market quickly and violently. But once it ends and infections decline, a new sentiment could emerge. Greed may replace fear as the flood waters recede.
This is why it’s important to think like the market. Remember the S&P 500 knew coronavirus was going to be a big deal in late February, when most people were still oblivious. Investors at the time ignored very strong economic news, knowing it would worsen — and it did.
Will it behave the same way now, but in the opposite direction? We’ll find out as early as tomorrow, when initial jobless claims and consumer sentiment are released. Investors’ response to those numbers may be a clue on how they’ll react to earnings in the next few weeks.
This is not to dismiss the risk, or to deny the odds of a recession. Deaths haven’t yet peaked and there’s still plenty of hardship with Americans out of work. But the stock market knows all of that, and may be starting to look past it.


