Stocks are falling early Wednesday following relief rallies from the major indexes. Small-cap stocks have lagged so far this week as large-cap technology continues to shine. Coming into Wednesday the major index ETFs performance is as follows: the Russell 2000 ETF (IWM) is -.75%, Nasdaq 100 ETF (QQQ) is +5.48%, S&P 500 ETF (SPY) is +1.95%, and the Dow Jones ETF (DIA) is +1.07%. Normally, most of the major indexes trade in sync, so why such a disconnect?
The IWM ETF, the weakest index, has been hampered by heavy weightings in two lagging sectors: Financial Services and Industrials. Financials and Industrials comprise more than 30% of the struggling ETF’s composition. IWM’s relative weakness is not new. One big red flag appeared in January when IWM failed to come close to making new highs, while all the other major indexes made significant new highs.
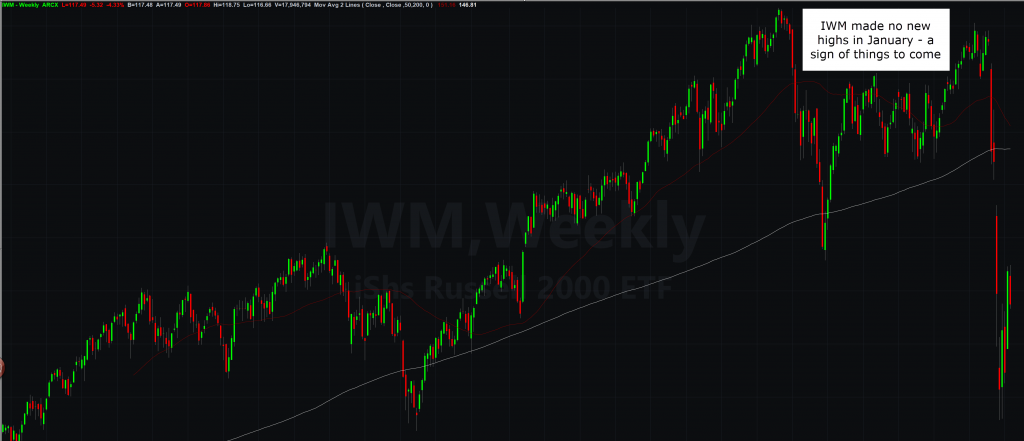
IWM remains the weakest index ETF
DIA has been slightly stronger than IWM but not by much. Like IWM, DIA also has heavy weightings in Industrials and Financials. The big story in the Dow this year is aircraft manufacturer Boeing (BA). The behemoth was in big trouble due to manufacturing issues long before the Corona Virus grounded many flights.
SPY is the broadest and most diversified of the major indexes. Like the others, it has seen strong gains off the lows, but no ETF has been stronger than QQQ.
Large-Cap Tech Shines
While every other index is stuck below the 50-day moving average (MA) and the 200-day MA, the QQQ has been able to regain both. The QQQ tracks 100 of the largest technology stocks in the Nasdaq and has been relatively strong in part due to the “FANG” stocks. In fact, Amazon (AMZN) and Netflix (NFLX) made new highs yesterday. Few would have guessed this would happen so quickly following the route that most stocks took as a result of Corona Virus fears. Both AMZN and NFLX have benefitted in some sense from the Corona Virus.
More people are online shopping, and more are certainly streaming movies from home. AMZN has seen such high demand, that the company is looking to bring on 75,000 new employees.
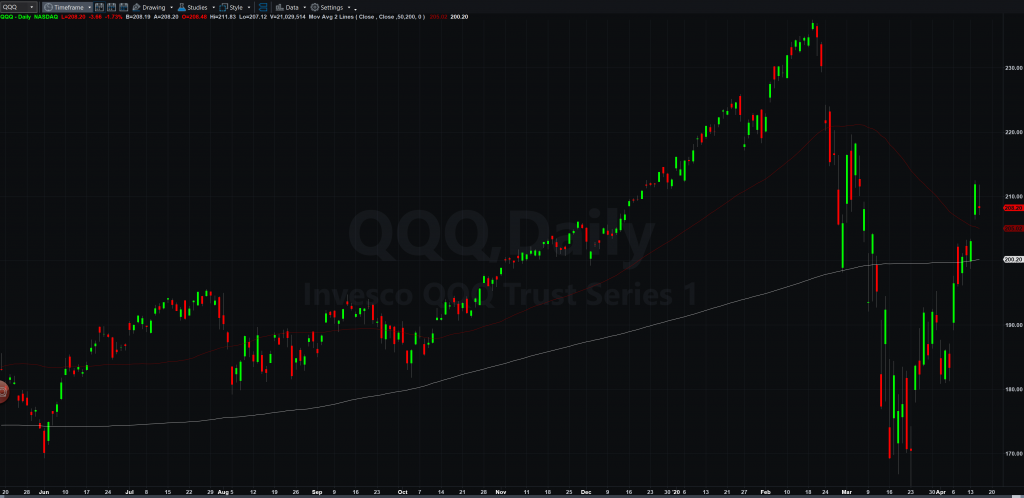
QQQ is first to regain key moving averages
Energy Takes a Beating
One of the biggest factors standing in the way of higher U.S. equities markets is energy. The oil ETF USO has been a leading indicator for stocks in recent months. USO began to break down in January, one month before the major equities markets. Oil has been weak since last year and now the Corona Virus pandemic has only added to the issues the commodity faces. Demand has been lackluster as travel has slowed and supply remains low. A historic cut from OPEC Plus over the weekend was of no help in buoying prices. USO is now testing lows from early March and is in the process of filling a daily price gap from April 2. If bulls want to take a stand, this would be a logical spot.
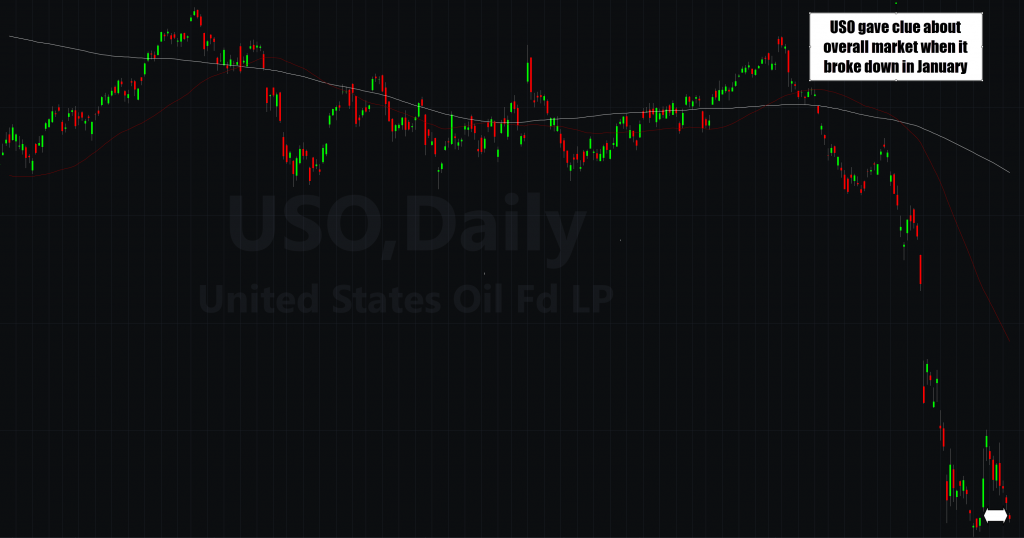
USO is filling in a daily gap and retesting previous lows. Bulls need to defend this level.
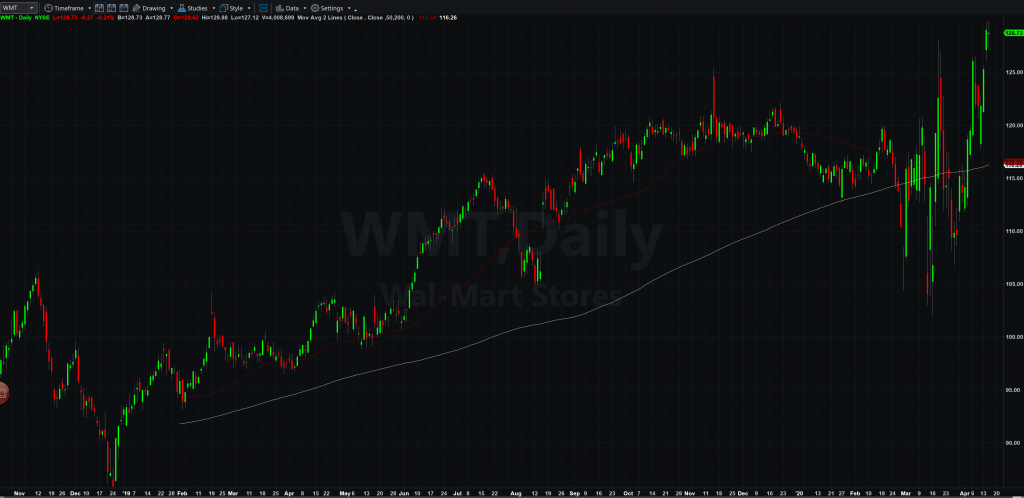
Retail, in general, is suffering as shown by the retail ETF XRT. Retail sales saw a drop of 8.7 percent month-over-month, a new record. On the other hand, mega “essential” retailers such as Costco (COST), Walmart (WMT), and Target (TGT) are showing relative strength. These companies are benefitting from a surge in demand for household goods such as toilet paper, groceries and cleaning supplies. WMT shot to new highs yesterday, while COST has been able to regain all of its key moving averages. Though TGT is the weakest of the bunch, it is getting buying support so far from the 200-day MA.
Discount Retailers Benefit from Virus Fears
Work from Home Theme
Stocks that allow people to work remotely such as Zoom (ZM), Slack (WORK), and Docusign (DOCU) have seen strong recent run-ups. Some investors are betting that even after the effects of the virus have been quelled, a change in behavior and work from home protocol will be everlasting. Teladoc (TDOC), an on-demand remote healthcare provider is another stock to watch if the current trends continue.
VIX on Watch as Overall Market is at Inflection Point
Traders will be watching how the major indexes behave as all of them are at or near the 200-day moving average. The 200-day is used as a gauge by traders to determine the long-term trend in stocks and indexes. While stocks are approaching resistance, the volatility index (represented by VXX ETF) is pulling into support. The VXX is now testing the 50-day moving average for the first time following the enormous advance is has had since February. If VXX gets support at these levels it may mean a pick up in volatility is in store for U.S. equities.
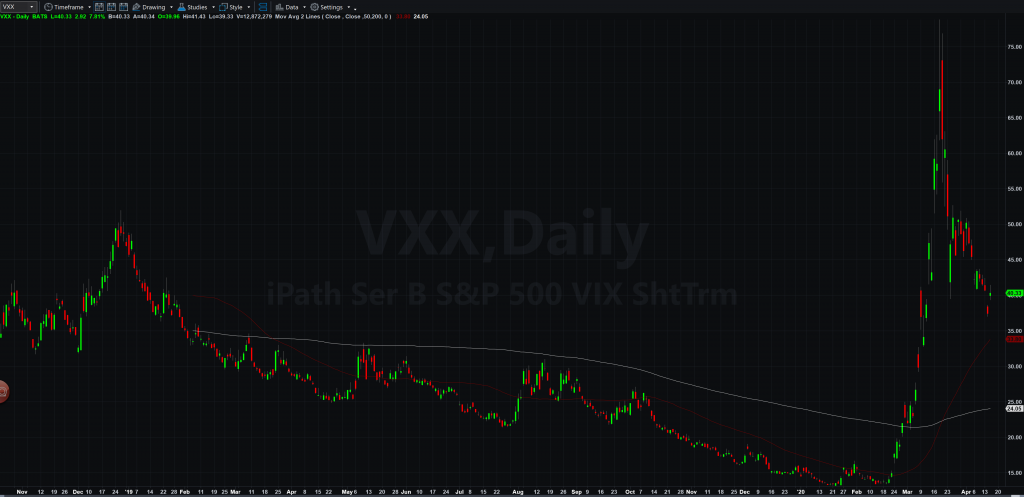
VXX testing the 50-day SMA for the first time since major move


