Editor’s note: This article was originally published on April 6, 2020.
Stocks fell again last week, but there may be signs the market is starting to see light at the end of the coronavirus tunnel.
The S&P 500 slid 2.1 percent between Friday, March 27, and Friday, April 3. Perhaps more importantly, the index had its worst month and quarter since the financial crisis: down 13 percent in March and 20 percent in the first quarter.
Still, we’ve entered a new month and a new quarter. Investors know social distancing has hammered the U.S. economy. They know 10 million Americans have sought jobless claims in recent weeks. They also have an inkling that the coming earnings season will have all kinds of warnings and uncertainties.
But they’re equally aware that Covid-19 has caused it all. Signs of the outbreak peaking may cause them to look past the short-term pain in hope of long-term gain. They may also anticipate more help from the Federal Reserve and Congress — especially in an election year.
Levels Hold Despite Horrible News
Financial markets held some key levels last week. This happened despite employment collapsing and officials projecting as many as 240,000 coronavirus deaths.
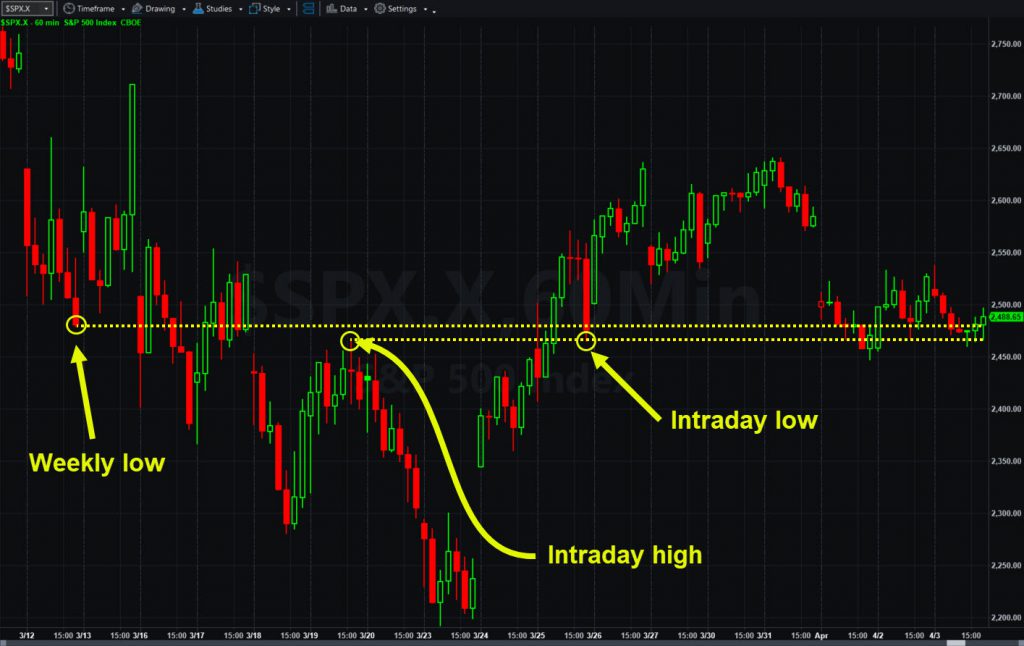
One of those levels was a zone on the S&P 500 between 2467 and 2478. The first was a daily high on March 19 and an intraday pivot on March 25. The second was the weekly low on March 12.

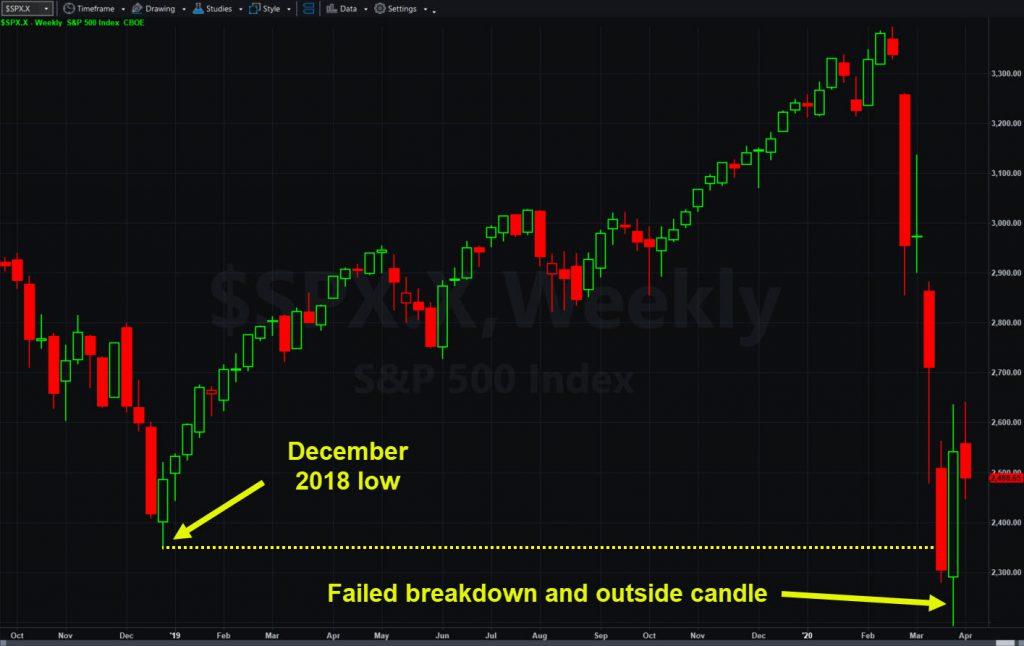
This zone also held after two potentially bullish reversal patterns. First was an outside week between March 23 and March 27. The second was a false breakdown (on the daily chart) on March 23.
The second interesting level was $20 on crude oil (@CL). The pandemic has erased more than half of the commodity’s value, making investors brace for a wave of bankruptcies in the energy sector.
But @CL held last week. It also followed a bullish outside week in late March — like the S&P 500. Attention will now focus on the possibility of Saudi Arabia and Russia cutting production. President Trump is spearheading the effort to save U.S. shale fields.
Energy and Biotech Strong
Speaking of energy, it climbed 5 percent last week. It was the strongest major sector last week, rebounding from 16-year lows.
Biotechnology stocks, consumer staples and gold miners also climbed. Airlines, home builders, banks and retailers dropped the most.

Devon Energy (DVN) was the biggest gainer in the S&P 500, up 33 percent. Diamondback Energy (FANG) and Halliburton (HAL) led with bounces of 32 percent and 19 percent, respectively.
Carnival (CCL), Kohl’s (KSS) and American Airlines (AAL) led to the downside. The cruise-ship operator dropped 41 percent. The department store shed 34 percent and the airline plunged 33 percent.
A Short Week, Then Earnings
This week only has four sessions because of Good Friday. It’s also relatively quiet in terms of scheduled news events.
Wednesday has oil inventories in the morning and minutes from the last Fed meeting in the afternoon.
Jobless claims and consumer sentiment follow on Thursday morning. They could be pretty bleak again.
But bleak is what people have come to expect. Consider one last tidbit. The American Association of Individual Investors’ weekly sentiment poll has been 50 percent bearish for four consecutive weeks. Can you guess the last time negativity was that extreme?
Answer: March 2009.
Have a great week.
Security futures are not suitable for all investors. To obtain a copy of the security futures risk disclosure statement Investment and Trading Disclosures Booklet – Futures.


