Earnings season can be tricky because so many companies have news and are moving. Fortunately, you can stay on top of everything with TradeStation.
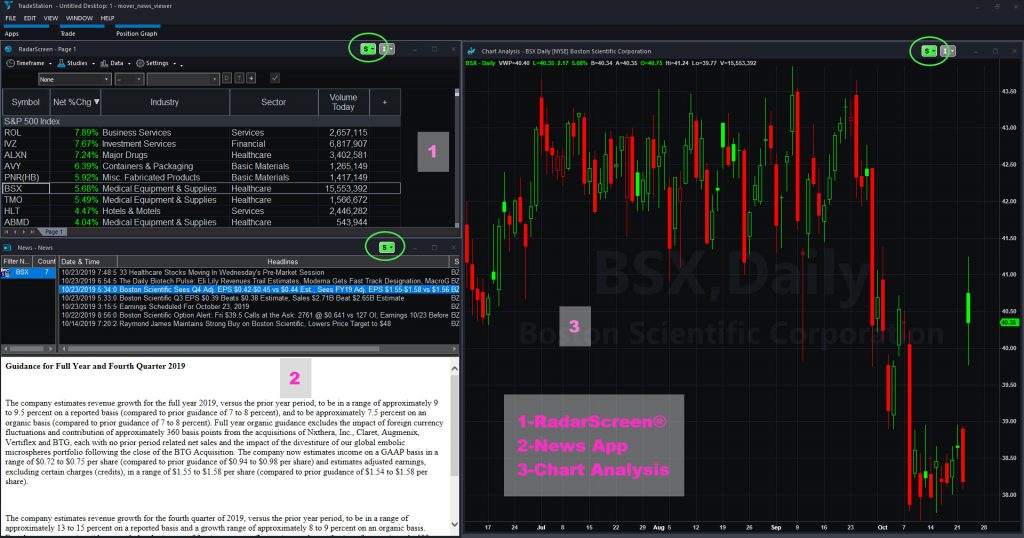
The screenshot below shows a work space that can help. It contains three apps available to all clients:
- RadarScreen®: A sortable grid that lets you track up to 1,000 symbols at a time.
- News: A tool that delivers up-to-date news for one or several companies.
- Chart Analysis: A price chart. This one shows daily candles.
TradeStation’s powerful Window Linking functionality holds it all together.
How to begin? First, I went to RadarScreen and imported all the members of the S&P 500 index. You can do this by clicking on Data -> Add Symbol list.
If other companies outside the index interest you, go to the bottom of the list and add their tickers. Sometimes people follow other stocks like Snap (SNAP), Roku (ROKU) or Tesla (TSLA).
Next, go to the column called “Net % Chg.” Clicking on the header will toggle between the biggest gainers and losers today.

You can scroll up and down the list. Clicking on a symbol will show its headlines in the News app below, and its price chart to the right.
Make the Most of Earnings Season
Functionality like this is especially useful at a time like this because hundreds of companies are reporting earnings. No human being can possibly keep track of them all, but TradeStation can give you an edge spotting the ones that are really moving.
This lets ordinary investors level the playing field with Wall Street professionals. After all, quarterly results are usually the single most useful piece of information on a stock. They not only show how a company’s performing but also give the market an opportunity to react and judge it.
In conclusion, it can be hard to keep up during earnings season because so much is happening at once. But TradeStation’s functionality can help you stay up to speed.


