Support and resistance may be at play on some key charts.
In case you don’t know, support and resistance are important price levels where buyers and sellers tend to be active. Traders often use them to decide when to enter or exit positions.
One technique is to buy a stock or commodity that’s bouncing at a support level. But when a support level fails to hold, sentiment can get bearish.
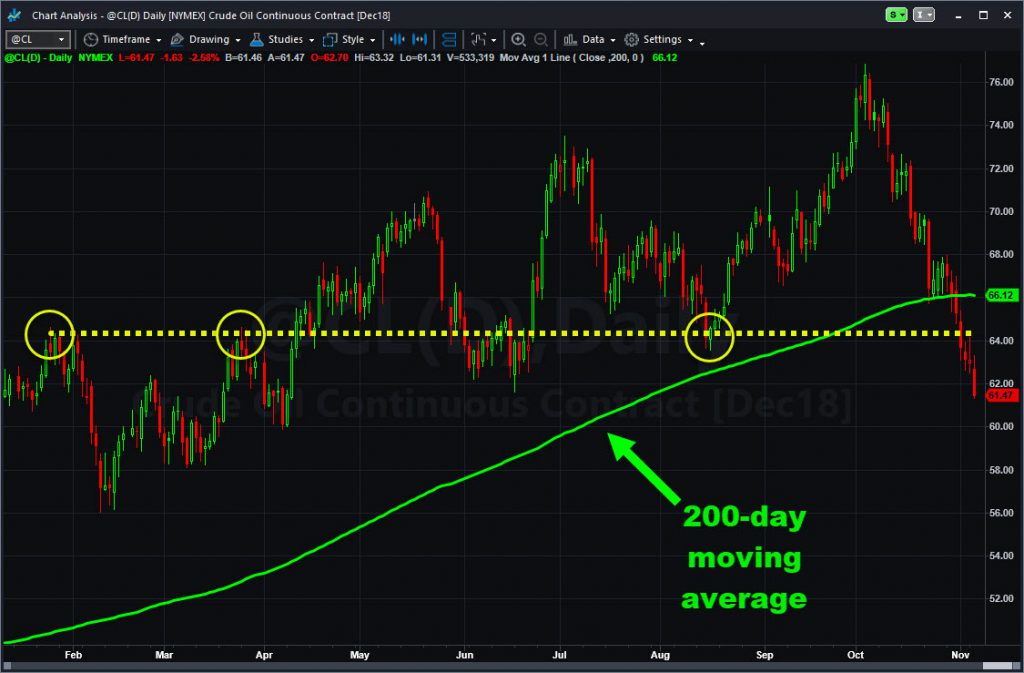
That could be happening on crude oil futures (@CL) right now. As the TradeStation chart below shows, multiple pivots have occurred in the $62-64 zone this year. It was resistance in February and April before turning into support in June and August.

@CL has cratered in the last month as inventories rise and global demand moderates. (Click here for the Market Insights post anticipating the decline.) Now it’s at risk of breaking down through the $62-64 zone.
Clients may want to keep an eye on this chart in coming weeks. Also remember there are plenty of ways to potentially trade this trend in the stock and options markets with energy companies. RadarScreen® shows these symbols have a lot of call and put volume:
- SPDR Oil & Gas Exploration ETF (XOP): Averaged 152,000 contracts/session the last month.
- U.S. Oil Fund (USO): Averaged 115,000 contracts/session the last month.
- SPDR Energy Fund (XLE): Averaged 54,000 contracts/session the last month.
- Exxon Mobil (XOM): Averaged 48,000 contracts/session the last month.
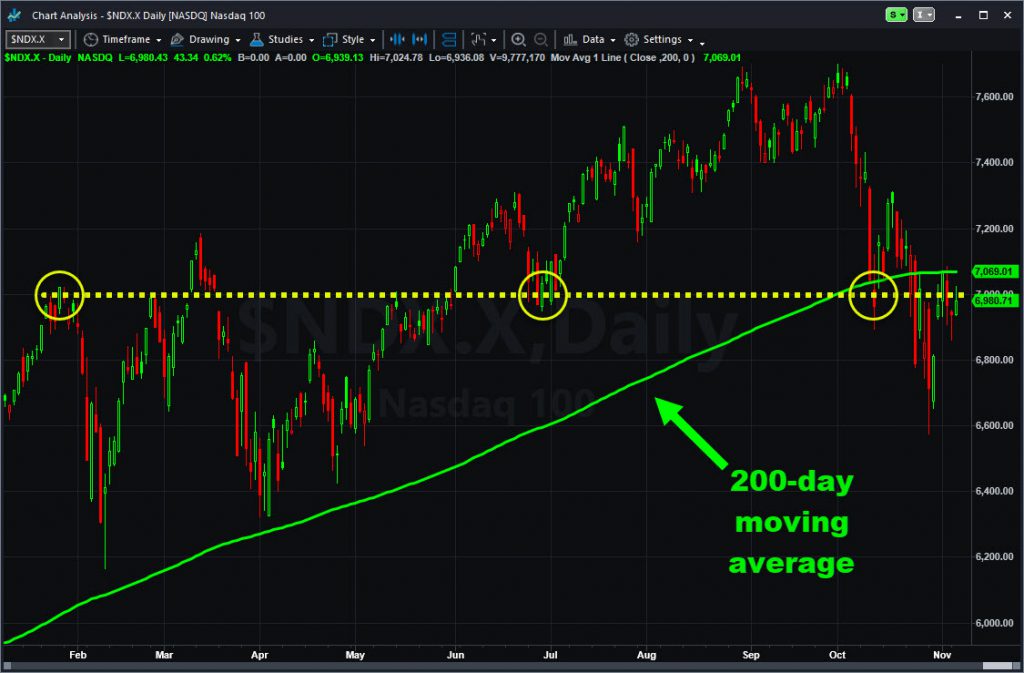
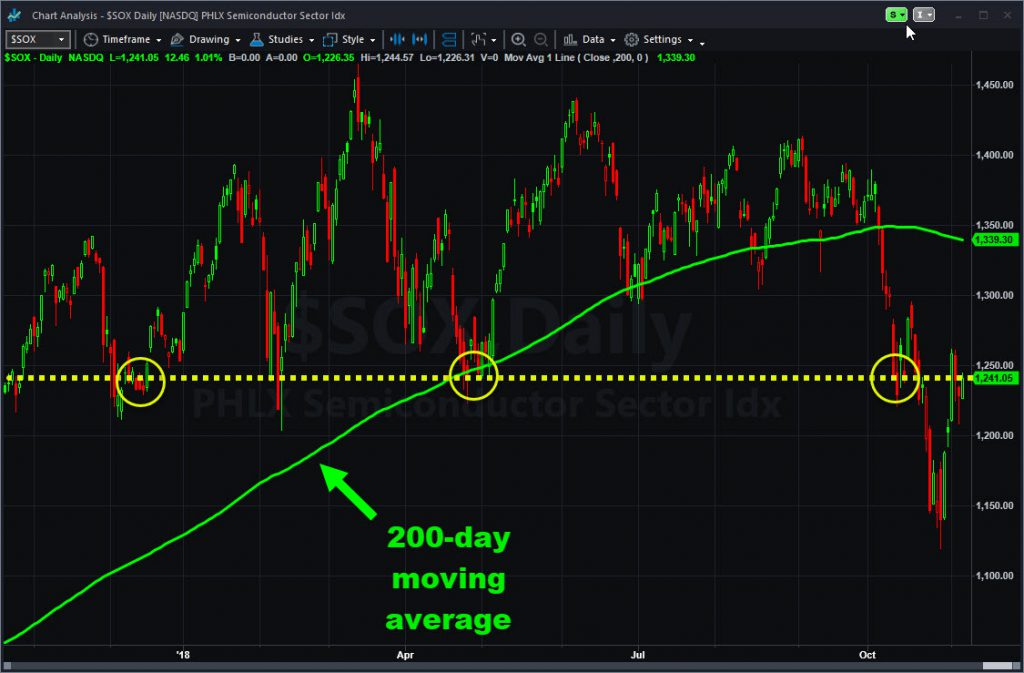
Tech is next. In particular, let’s view the Nasdaq-100 ($NDX.X) and the Philadelphia Semiconductor Index ($SOX). Both are trying to hold key levels after October’s big selloff in growth stocks.

$NDX.X peaked at 7000 in January and then bounced in that level in late June. It briefly offered support last month but now the index is struggling to reclaim that price zone. In this case, old support may have “become new resistance.”
In other words, a buy point may now be a selling point — another potentially bearish setup.
$SOX has done something similar around 1240. It was support in December, February, April and early October. This month it’s potentially offering resistance.
Remember, like oil, fundamentals have worsened recently in big Nasdaq stocks and semiconductors. Click here for more.
Disclaimer: This post is intended for educational purposes only and shouldn’t be interpreted as a trade recommendation.


