Stocks fell yesterday, but it almost felt like a bullish day when you consider how much worse it could have been.
The S&P 500, Nasdaq-100 and Dow Jones Industrial Average were down 2-3 percent about halfway through the morning. They probed some key levels for about 30 minutes before reversing higher and erasing most of their losses.
Let’s see if those prices hold today. If they do, some traders may look for the pendulum to swing back in a more bullish direction — especially when you consider the calendar of upcoming events.
For example, some of the key tech giants that have fueled the market’s rally issue results in the next few days: Microsoft’s (MSFT) this afternoon. Then Amazon.com (AMZN) and Alphabet (GOOGL) lead the busiest session of earnings season tomorrow.
In addition to those reports, the European Central Bank meets tomorrow and U.S. gross domestic product is due on Friday. Next week brings more economic data, along with some product launches from Apple (AAPL). Will those crash the market, or might investors put money to work after the uncertainty passes?

Getting back to the charts, the big three indexes held these potentially key levels:
- The Nasdaq-100 held its January high of 7000, and its 200-day moving average.
- The Dow Jones Industrial Average clawed back to hold last week’s low and an old peak from April around 24,859. It also held its 200-day moving average.
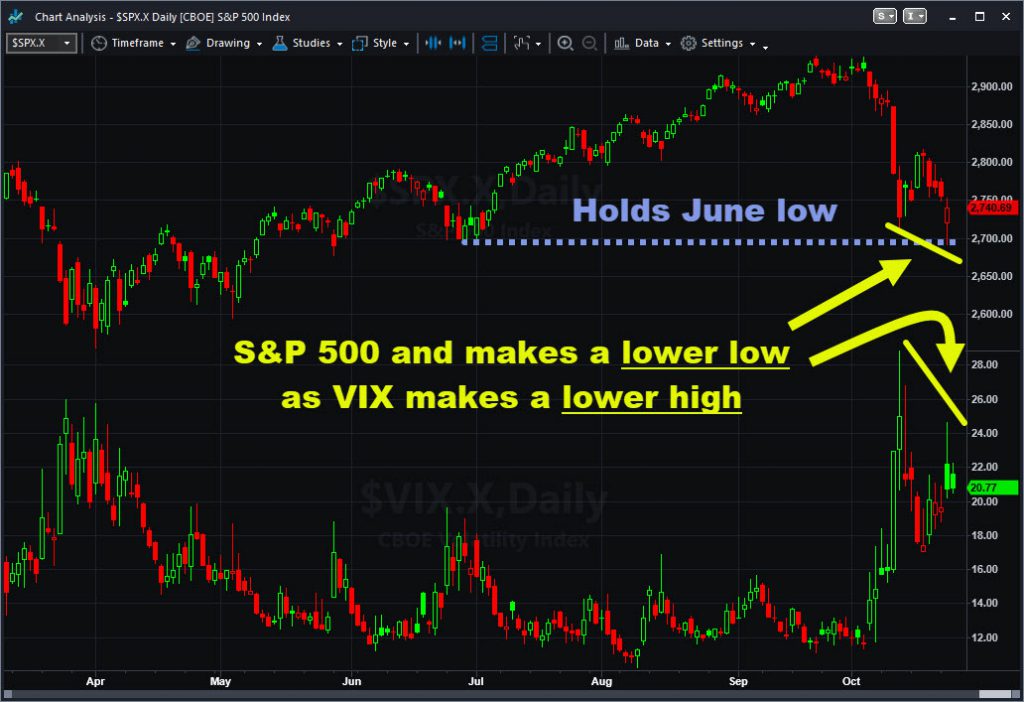
- The S&P 500 managed to bounce at its June low of 2691.
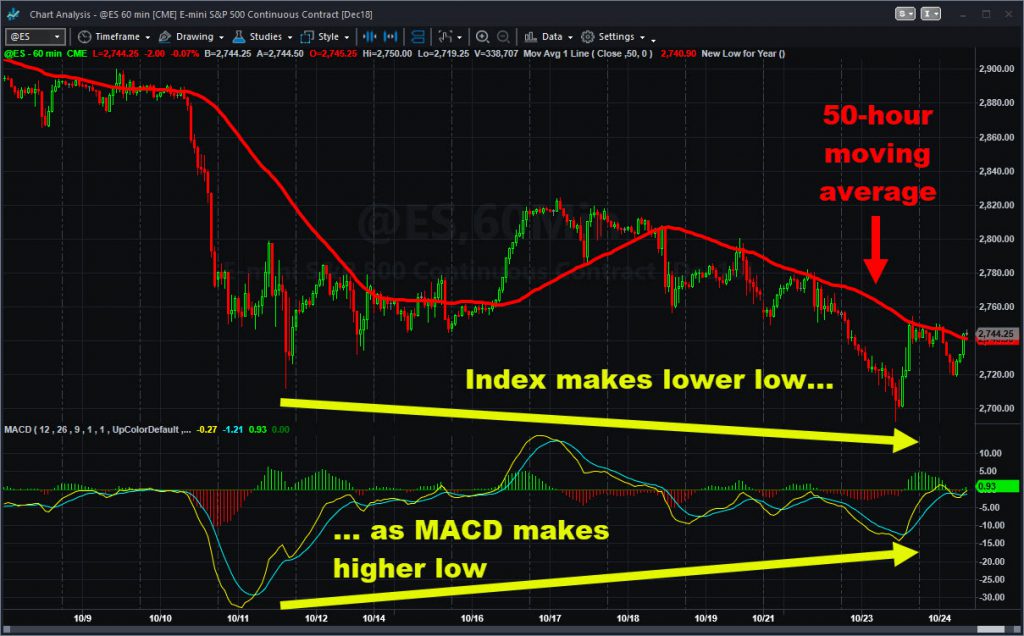
Aside from those patterns, some technicians may have noticed some positive divergences. Cboe’s VIX “fear index,” for instance, made a lower high even as the S&P 500 made a lower low. And on the hourly chart of S&P 500 futures, the moving average convergence/divergence (MACD) showed a similar pattern.
In conclusion, it’s not time to be overconfident. But some potential patterns are emerging that could help sentiment if current levels hold.
Disclosure: This post is for educational purposes only and shouldn’t be considered a trade recommendation.


