Markets remain very active as investors try to assess the damage from coronavirus.
There’s no shortage of headlines as forecasters and politicians brace for an economic slowdown. With so much going on, we wanted to focus in on three stories that might be of most use in the coming session.
Tesla Has Had a Monster Pullback
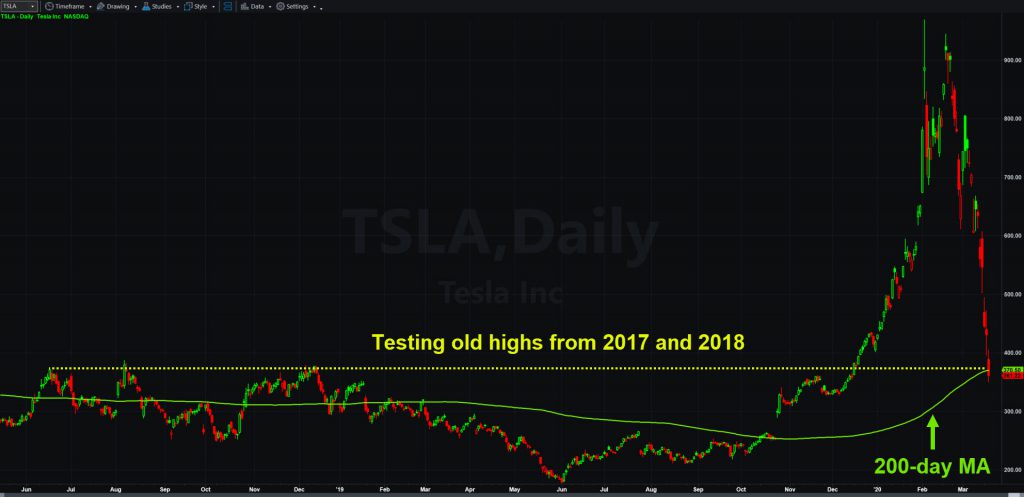
Tesla (TSLA) began a huge turnaround in October after fixing its production issues. That triggered one of the biggest short squeezes ever, lifting the electric car more than 250 percent by early last month.
Since then TSLA stalled, and then crashed along with the rest of the market. It’s now down more than 50 percent from its all-time high of $968.99 on February 4. Chart watchers may notice two other things.

First, TSLA has pulled back to old highs. Today’s low around $350 is about $28 below its peaks in 2017 and 2018. If the shares hold these levels it could be an example of “old resistance” becoming “new support.” That’s often bullish in the eyes of technicians.
Second, TSLA is back to its 200-day moving average. Today’s the first time it’s tested that line since the the shares began their blistering run on October 24.
Will long-term trend followers start getting interested soon?
Safety Plays Are Trying to Lead a Bounce
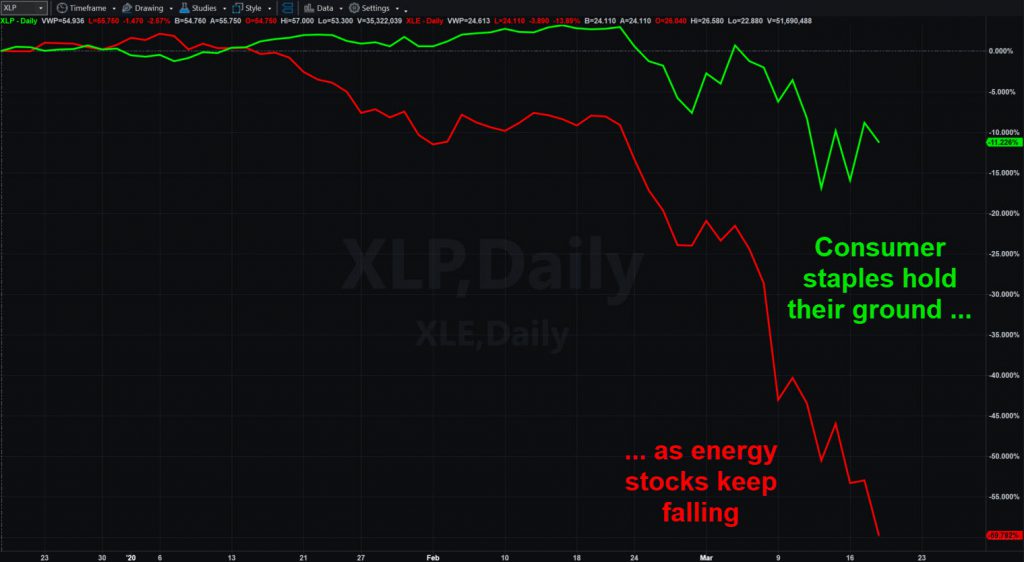
A flight to safety has been one of the starkest trends since the correction began. TradeStation data shows investors have favored sectors like consumer staples, health care and utilities. Those are less vulnerable to a potential recession.
Economically sensitive companies like energy and financials, however, have taken a beating. Less travelling has sent oil to its lowest prices since the early 2000s, dragging producers down along the way.

Lower interest rates and the risk of borrowers defaulting have hammered banks. It’s even pushed major lenders like Bank of America (BAC) and JPMorgan Chase (JPM) back below book value.
Small Caps Are Doing Horribly
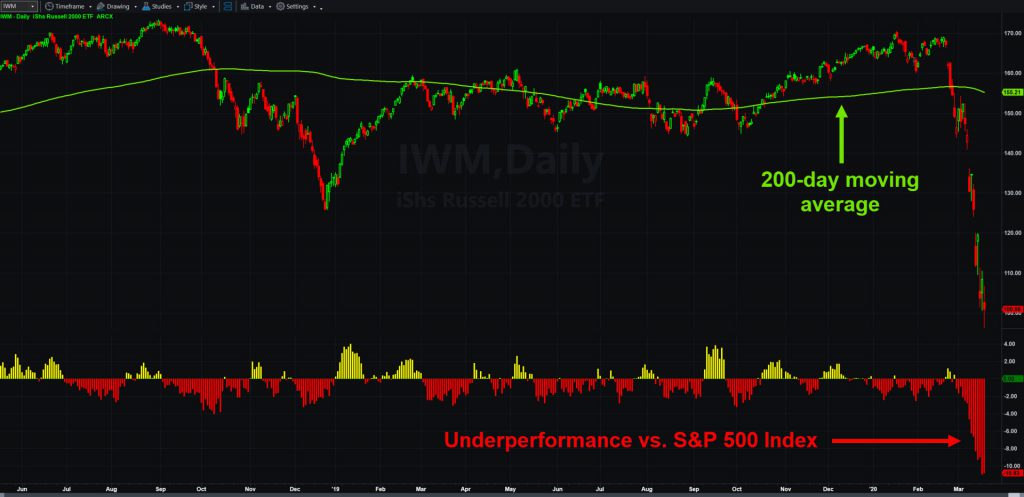
This trend has weighed heavily on smaller companies that are more sensitive to a potential recession.
The histogram at the bottom of this chart plots the relative strength of the Russell 2000 small cap fund (IWM). Because it’s benchmarked to the S&P 500, this indicator adjusts for drawdowns in the broader market.
It shows that IWM has underperformed the S&P 500 by 11 percentage points in the last two weeks. That’s greater than any period since TradeStation’s data begins in 2000. During the 2008 financial crisis, for example, it lagged by no more than 8 percentage points.

One of IWM’s problems is sector mix. Its holdings focus more on industrial stocks and less on consumer staples. There are also fewer technology stocks.
Investors may want to keep these sector and index trends in mind when the market begins to stabilize. The economy will probably be near recession with widespread disruptions to daily life. Even when buyers come back, some parts of the market may bounce more than others.


