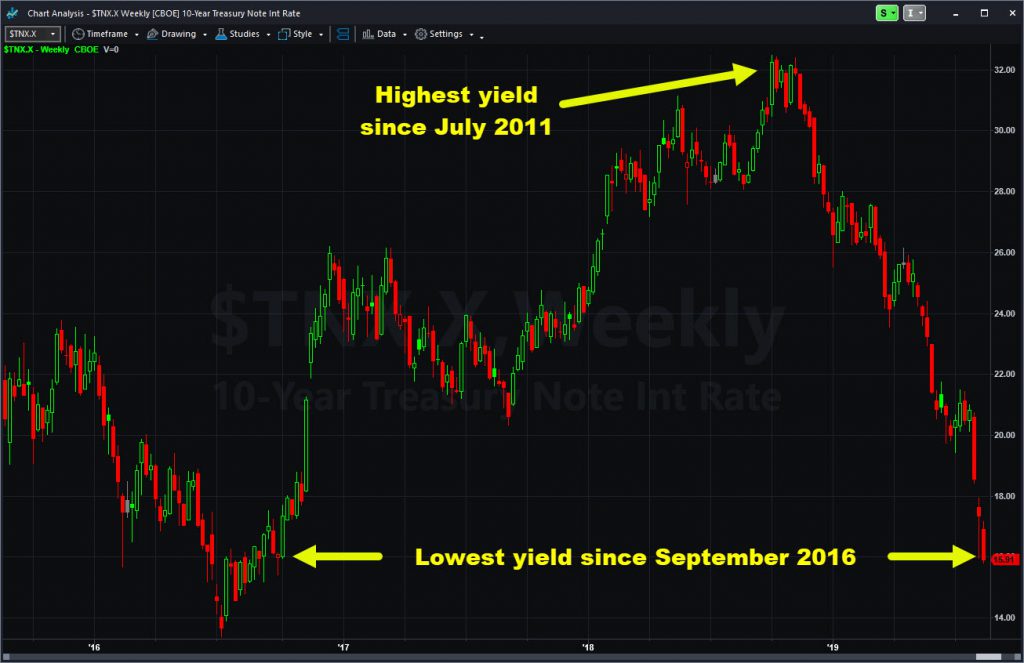
The big story today is that weak economic numbers overseas caused the yield curve to invert.
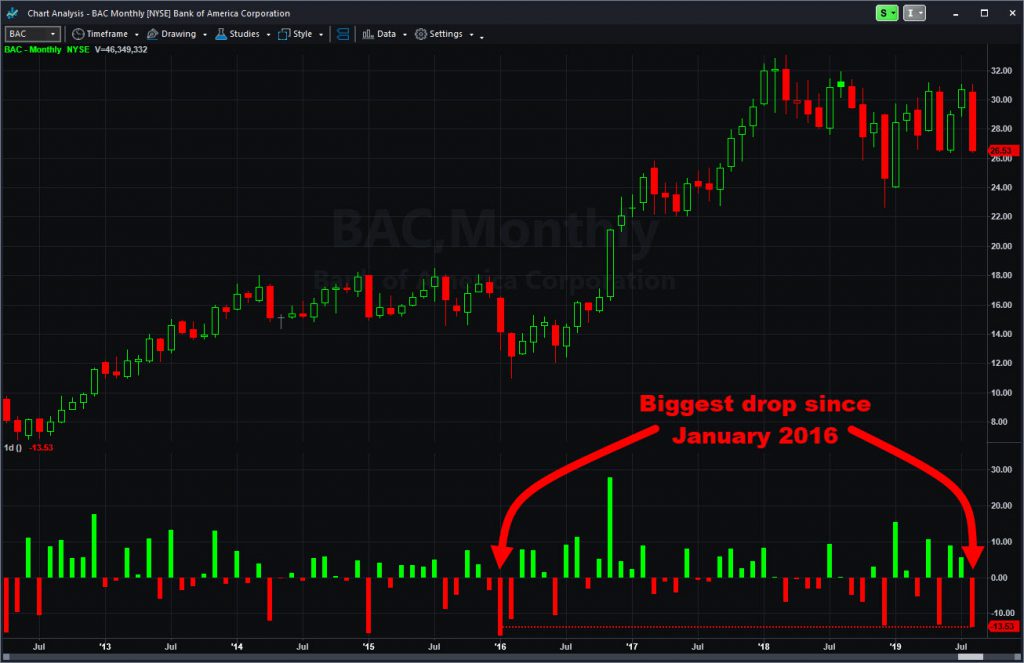
That means the yield on 10-year Treasury bonds fell below the two-year rate. Stocks, especially financials, are crashing as a result.
The “inverted curve” is a potentially big deal because it’s often considered as a sign of looming recession. (That logic is that long-term yields anticipate slower growth in the future than the current reality of short-term rates.) It last happened in 2007, shortly before the U.S. economy turned negative.
Regardless of whether a recession is coming, the current situation is important in several ways.

First, it’s bad news for most financials because they borrow at short-term rates and lend at longer term rates. A narrowing or inversion of those values erases their profits, or “net interest margin.”
Know Your Options
This can be good news for traders because banks and financials have tons of options volume. That creates opportunities to leverage even small moves with calls and puts. Bank of America (BAC), the SPDR Financial Fund (XLF), Citigroup (C), JPMorgan Chase (JPM) and Wells Fargo (WFC) all average more than 50,000 contracts per day.
Second, the inverted yield curve results from global economic weakness. China reported a triple-miss on some key data overnight. Industrial production had its lowest reading in 17 years, while retail sales and fixed investment lagged estimates. Today’s disappointments follow a 27-year low on gross domestic product in mid-July.
Germany and the rest of Europe also had heart-breaking industrial numbers this morning, following a bleak Zew sentiment index yesterday. This makes a European Central Bank rate cut on September 12 increasingly likely.

Speaking of central banks, here are some upcoming Federal Reserve events:
- Aug. 21: Minutes from the last Fed meeting
- Aug. 22-24: Fed symposium at Jackson Hole, Wyoming. No schedule is available yet, but Chairman Jerome Powell other bigwigs will likely speak.
Energy Hammered
Third, energy stocks are getting hammered because slower growth overseas means less demand for oil (@CL). Crude inventories also rose more than expected today — another piece of bearish news.
The energy glut comes just two days after an historic crash in grain prices. All the commodity weakness will make economists expect even slower inflation. That, in turn, will drag interest rates lower, and invert the yield curve more.
While the current situation is negative for most of the market, it can draw money to safe-havens like gold miners, utilities, and real-estate investment trusts.
Interestingly, one set of financial stocks is bucking the bearish tide: financial exchanges like Intercontinental (ICE), Cboe (CBOE) and CME (CME).
In conclusion, interest rates signal a weaker economic environment going forward. Banks, global stocks and energy are feeling the most of the pain. Hopefully this post helps you understand the situation and know some of the key things to watch.


