TradeStation Has Powerful Tools for Earnings Season
David Russell
September 21, 2025
Quarterly earnings can be major events in the stock market, giving key information about companies and providing trading opportunities. This article will highlight some ways TradeStation can help customers before and after these reports.
Planning for Earnings
Knowing the dates of results is key to planning. TradeStation makes this information easily available with RadarScreen™ and charts.
Clicking on the Apps button at the top left of the work space or
Right clicking on the desktop → New Application → RadarScreen.
From RadarScreen click on the Studies menu → Add Study.
In the dialog that appears, select “Next Earnings Date RS”. Click the “Add ->” button and then the OK button.
This is included in the “Earnings Dates” tab of the included workspace. (See below.)
Here are the steps to add earnings dates to charts:
Launch Chart Analysis from the Apps button or by right-clicking on the work space
Once it’s open, click on Studies → Add Study
In the dialog that appears, select “Next Earnings Date Studies – Next Earnings Date.”
Click the OK button.
Researching Fundamentals
TradeStation can display fundamental data on companies in several ways. The attached workspace includes the prebuilt tab “Fundamentals” with common indicators like the Price / Earnings ratio and EPS Growth.
With TradeStation running, click on the file “EARNINGS TOOLS 2024.ELD”.
Click the “Next >” button on the first dialog box
Several studies will appear.
Click “Finish” to import these into TradeStation.
Click on “Earnings Tools 2024.tsw”
This workspace relies on studies imported from the .ELD file above.
Its “Fundamentals” tab contains key indicators.
Tools for After Earnings
Some traders may want to avoid the volatility of earnings and enter positions after the news has passed. For example, stocks might rally on strong results and pull back in a week or two later.
RadarScreen can help in those scenarios as well various types of alerts. The included workspace features a few potential examples.
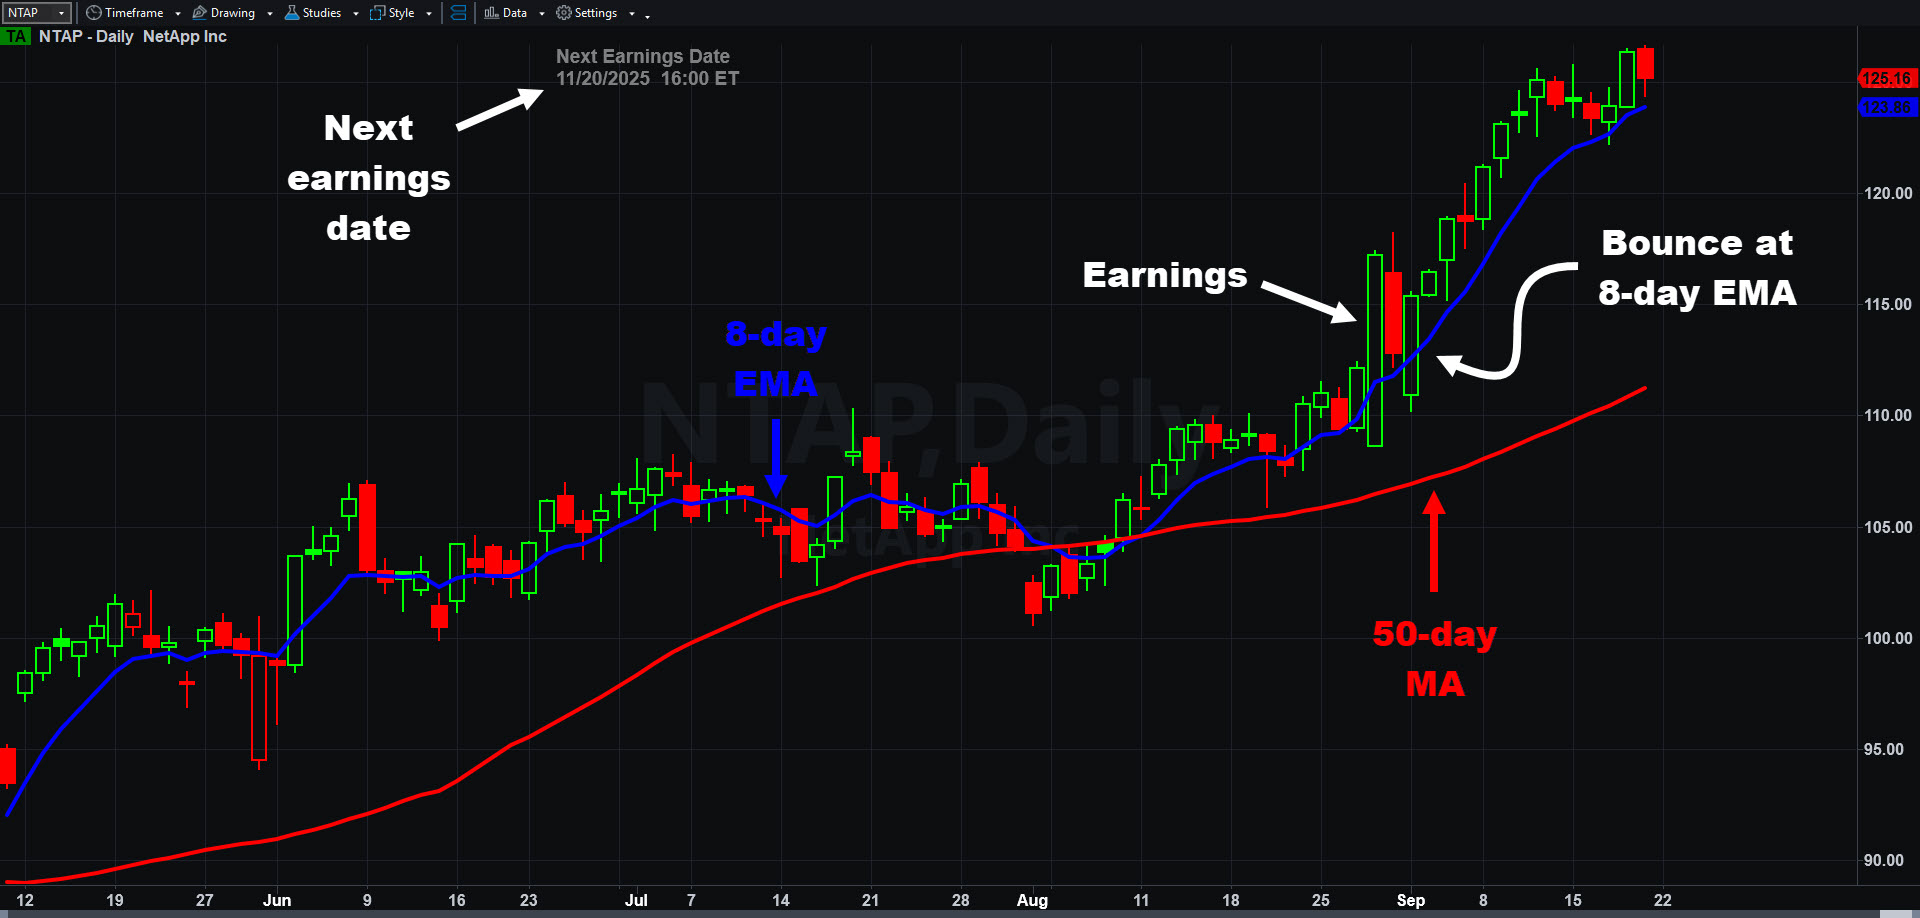
NetApp (NTAP), daily chart from the the included workspace. Notice how prices pulled back to hold the 8-day exponential moving average after the last earnings report.
Simple price alerts: The “Last” indicator doesn’t simply show the most recent price for a security. It can also send alerts when prices cross specific levels.
Double clicking on a cell brings up the Customize Indicator dialog.
Select the Inputs tab and set “HiAlert” to a price above the current price. Set “LoAlert” to a price below the current level.
Select the Alerts tab to enable the alert. You can also specify how it should provide notification.
Note: Triggered alerts are archived in the Message Center, which can be accessed at View → Messages → Message Center.
Dynamic price alerts: In addition to simple price alerts, TradeStation has dynamic alerts that adjust as prices change over time. The included workspace features three examples:
Mov Avg 1 Line: The same indicator that plots simple moving averages on charts can also tell you when prices cross a moving average.
EMA w Alert on Cross: This custom indicator can send alerts when prices cross an exponential moving average.
Keltner Channel: This indicator draws Keltner Channels on price charts, showing potential ranges of movement. It can also send alerts when prices cross the upper or lower bands.
Bollinger Bands: This popular indicator draws channels that widen or narrow based on volatility. RadarScreen can send alerts when prices cross above or below the upper and lower bands.
Dynamic alerts are also managed with the Inputs and Alerts tabs on the Customize Indicator dialog. Many other indicators on RadarScreen support similar kinds of dynamic price alerts.
David Russell is Global Head of Market Strategy at TradeStation. Drawing on more than two decades of experience as a financial journalist and analyst, his background includes equities, emerging markets, fixed-income and derivatives. He previously worked at Bloomberg News, CNBC and E*TRADE Financial.
Russell systematically reviews countless global financial headlines and indicators in search of broad tradable trends that present opportunities repeatedly over time. Customers can expect him to keep them apprised of sector leadership, relative strength and the big stories – especially those overlooked by other commentators. He’s also a big fan of generating leverage with options to limit capital at risk.
TradeStation’s platform is known for letting customers build their own tools. It also provides a series of calculated indexes for advanced technical analysis.
Stock prices often zig and zag instead of moving in a straight line. Today we’ll explore Fibonacci retracements, a popular tool for navigating ups and downs in stock and futures markets.
First-quarter earnings season has begun with an explosive move in semiconductor and IT hardware stocks.
Explore the Crossroads Summit
You are leaving TradeStation.com for CrossroadsSummit.com, an exciting new conference that highlights opportunity at the intersection of chaos and innovation. Click the button below to acknowledge that you understand that you are leaving TradeStation.com.
You are leaving TradeStation.com for another company’s website. Click the button below to acknowledge that you understand that you are leaving TradeStation.com.
This event is hosted on YouCanTrade. The information for this event is being provided for informational and educational purposes only.
You are leaving TradeStation Securities and going to YouCanTrade. YouCanTrade is an online media publication service which provides investment educational content, ideas and demonstrations, and does not provide investment or trading advice, research or recommendations. YouCanTrade is not a licensed financial services company or investment adviser and does not offer brokerage services of any kind.
TradeStation Securities, Inc. provides support and training channels hosted on YouCanTrade, its affiliate. Other than these support and training channels, any services offered by YouCanTrade are not sponsored, endorsed, sold or promoted by TradeStation Securities and it makes no representation regarding any YouCanTrade goods or services.
To acknowledge you are leaving TradeStation Securities to go to YouCanTrade, please click